Despite being one of the most developed nations in the world, the United States continues to grapple with major disparities in public education, particularly at the high school level.
While many schools boast AP scholars and Ivy League hopefuls, others are stuck in a vicious cycle of academic failure, dropout crises, and chronic absenteeism.
This article takes a close, data-driven look at five of the lowest-performing high schools in the country.
Using verified statistics from SchoolDigger, Public School Review, state report cards, and independent media outlets like NPR, Chalkbeat, and RiverBender, we break down the core challenges each school faces-from graduation rates as low as 33% to math proficiency levels near zero.
| Rank | School Name | Location | Graduation Rate | Math Proficiency | Reading Proficiency | Chronic Absenteeism | Dropout Rate | Key Issues (2024-2025) |
|---|---|---|---|---|---|---|---|---|
| 5 | East St. Louis Senior High School | East St. Louis, Illinois | 69% | ≤1% | 3% | 56.1% | 4.3-8.7% | High poverty, unsafe community, low engagement |
| 4 | Detroit Collegiate Preparatory High School at Northwestern | Detroit, Michigan | 56.3% | 8% | 17% | 68% | 13.8% | Chronic absenteeism, staff shortages, and low readiness |
| 3 | Thomas Jefferson Senior High School | Los Angeles, California | 73-94% | 5% | 32% | 21-55% | 5.7-47.7% | Absenteeism, legal issues, and poor course structure |
| 2 | Ballou High School | Washington, D.C. | 65-69% | ≤1% | 5% | 50%+ (est.) | Not reported | Truancy crisis, graduation scandals, and low college readiness |
| 1 (Worst) | Hirsch Metropolitan High School | Chicago, Illinois | 33-49% | ≤10% | ≤10% | 51-81% | 8.6-18.6% | Severe absenteeism, minimal AP access, and underfunded |
1. Hirsch Metropolitan High School, Chicago, Illinois
Hirsch Metropolitan High School has faced significant challenges in recent years, reflected in its performance metrics:
| Metric | Value | State Average | Notes |
|---|---|---|---|
| Graduation Rate | 49% | 87% | Four-year graduation rate |
| Math Proficiency | ≤10% | 28% | Percentage of students meeting proficiency |
| Reading Proficiency | ≤10% | 30% | Percentage of students meeting proficiency |
| Chronic Absenteeism | 51.7% – 81.0% | Not specified | Percentage of students chronically absent |
| Dropout Rate | 8.6% – 18.6% | Not specified | Annual dropout rate |
Hirsch Metropolitan High School continues to be one of the lowest-performing high schools in Illinois.
According to SchoolDigger, the four-year graduation rate has hovered between 33% and 49% in recent years, far below the state average of around 87%.
Dropout rates range from 8.6% to 18.6%, meaning nearly one in five students leaves school each year without finishing. In terms of academic proficiency, less than 10% of students meet standards in both math and reading, according to Public School Review, which places the school among the bottom 1% in Illinois.
Absenteeism, Enrollment Decline, and Limited College Readiness
The chronic absenteeism rate is one of the most alarming in the city.
As cited by the Department of Education, up to 81% of students are chronically absent, meaning they miss more than 10% of the school year. With just over 160 students enrolled, Hirsch faces issues with program availability; advanced courses such as AP are virtually nonexistent.
Only 1% of students participate in AP coursework, according to Research Gate. Despite a low student-teacher ratio of 10:1, the lack of academic rigor and student engagement keeps college readiness indicators near zero.
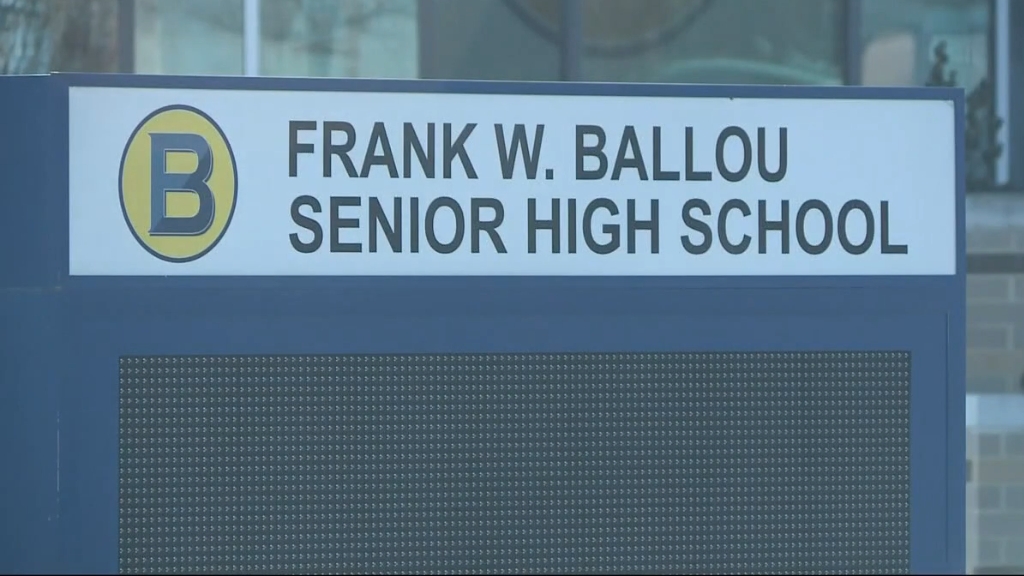
2. Ballou High School, Washington, D.C.

| Metric | Value | District Average | Notes |
|---|---|---|---|
| Graduation Rate | 65-69% | Not specified | Four-year graduation rate |
| Math Proficiency | ≤1% | Not specified | Percentage of students meeting proficiency |
| Reading Proficiency | 5% | Not specified | Percentage of students meeting proficiency |
| Science Proficiency | ≤5% | Not specified | Percentage of students meeting proficiency |
Ballou High School gained national attention in 2017 when it was revealed that many seniors graduated despite extreme absenteeism, as reported by NPR/WAMU. Current data still shows serious concerns.
According to Public School Review, only 1% of students are proficient in math and 5% in reading.
The graduation rate ranges between 65% and 69%, but those numbers are suspected to be inflated due to previous diploma scandals.
Attendance Problems and Low College Readiness
Ballou suffers from some of the highest truancy and chronic absenteeism rates in Washington, D.C.
Though exact current absentee data varies, past reports showed that over half of the student body had 90+ unexcused absences, yet still graduated.
The school has a very low college readiness index, with minimal AP participation (around 10%) and average SAT scores around 950.
These issues, compounded with leadership turnover and a 97% low-income student population (OSSE.DC), continue to hinder progress.
3. Thomas Jefferson Senior High School, Los Angeles, California
| Metric | Value | District Average | Notes |
|---|---|---|---|
| Graduation Rate | 73% – 94.3% | Not specified | Four-year graduation rate |
| Dropout Rate | 5.7% – 47.7% | Not specified | Annual dropout rate |
| Chronic Absenteeism | 21.4% – 55.1% | Not specified | Percentage of students chronically absent |
Jefferson High has long struggled to maintain consistent academic outcomes. According to Great Schools, its graduation rate has ranged from 73% to 94%, though higher figures often result from credit recovery programs rather than academic achievement.
In the worst-reported year, the dropout rate spiked to 47.7%. Chronic absenteeism has climbed drastically-from 21.4% in 2018 to 55.1% in 2022, according to the same source. These figures place Jefferson among the worst-performing schools in California for attendance and retention.
Infrastructure Failures and Learning Gaps
In 2014, Jefferson was subject to legal action when it was revealed that student schedules were so broken that many were placed in fake or non-credit “service” classes, prompting a court-mandated intervention (ACLU Report via NPR).
According to NCES, only 5% of students are proficient in math and about 32% in reading. AP participation is modest (~23%), but passing rates remain low. The student-teacher ratio is around 21:1, and with high staff turnover, students receive inconsistent instruction in an already under-resourced environment.
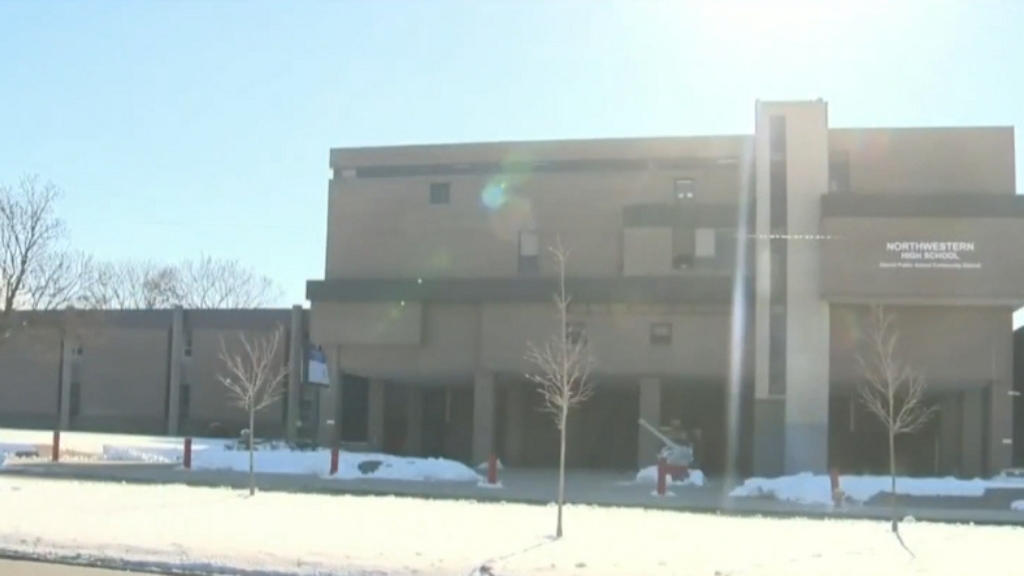
4. Detroit Collegiate Preparatory High School at Northwestern, Detroit, Michigan
| Metric | Value | State Average | Notes |
|---|---|---|---|
| Graduation Rate | 56.3% | 82.8% | Four-year graduation rate |
| Dropout Rate | 13.8% | 8.2% | Annual dropout rate |
According to Detroit Public Schools, the school’s four-year graduation rate is around 56%, significantly below the state average of 82.8%.
The dropout rate is about 13.8%, and test scores confirm serious achievement gaps: only 8% of students are proficient in math and 17% in English, per the MI School Data portal.

Chronic Absenteeism and Lack of College Pipeline
Like many Detroit schools, Northwestern suffers from rampant absenteeism-68% of students are chronically absent, as reported in Chalkbeat.
Only 12% of students take AP courses, with few passing any exams. The school’s 14:1 student-teacher ratio offers small classes, but learning remains hindered by lack of qualified instructors, neighborhood violence, and deeply entrenched poverty.
Detroit has the lowest-performing large district in the country per national NAEP data, and DCP at Northwestern is one of its weakest links.
5. East St. Louis Senior High School, East St. Louis, Illinois
| Metric | Value | State Average | Notes |
|---|---|---|---|
| Graduation Rate | 69% | Not specified | Four-year graduation rate |
| Math Proficiency | ≤1% | Not specified | Percentage of students meeting proficiency |
| Reading Proficiency | 3% | Not specified | Percentage of students meeting proficiency |
| Chronic Absenteeism | 56.1% | 26.3% | Percentage of students chronically absent |
| Dropout Rate | 4.3% – 8.7% | Not specified | Annual dropout rate |
East St. Louis Senior High School consistently ranks at the bottom statewide for academic outcomes. According to Niche, only 1% of students are proficient in math and 3% in reading, placing it among the worst in Illinois.
The graduation rate sits at 69%, nearly 20 points below the state average. Surprisingly, the school receives over $28,000 in pupil funding, as detailed by RiverBender.
Chronic Absenteeism and Community Challenges
The school has some of the worst attendance metrics in the state. Illinois Policy notes that 56.1% of students are chronically absent, far exceeding the Illinois state average. Dropout rates range from 4.3% to 8.7% per year.
Despite reasonable class sizes (16:1 student-teacher ratio), academic engagement is severely lacking. High poverty, local crime, and the struggling District 189 all contribute to East St. Louis’s persistent underperformance.
Conclusion
After reviewing the performance metrics and structural challenges facing these five schools, one conclusion is unavoidable: America’s lowest-performing high schools are not just struggling-they’re in crisis.
While each institution operates in a different state and context, the patterns are eerily consistent. Nearly all have:
- Graduation rates under 70%
- Math and reading proficiency below 10%
- Chronic absenteeism affecting over half the student body
- High dropout rates and almost non-existent college readiness
These aren’t isolated “bad apples”-they are the visible results of deeply systemic issues in American education: underfunded districts, unsafe neighborhoods, a lack of wraparound services, and educational policies that prioritize metrics over meaningful learning.
In my view, we cannot keep relying on data transparency alone to fix these schools. What’s needed is massive reinvestment, not just in test prep or teacher hiring, but in mental health, safe housing, and family support programs. Until that happens, these schools-and the students inside them-will continue to fall through the cracks.


