The average salary per month in the US in 2025 sits at about $5,625, but that number hardly tells the full story. Some people take home far more, others far less.
Median weekly earnings are around $1,194, which works out to about $5,174 a month. Pay depends heavily on where you live and what kind of work you do.
States with stronger job markets tend to offer better wages, while areas with higher living costs see smaller paychecks stretch thinner.
More details are explained in the following sections.
Here is the Breakdown of Average and Median Monthly Salary per State in the US
| State | Average Monthly Salary | Median Monthly Salary |
|---|---|---|
| District of Columbia (D.C.) | $7,212 | $7,337 |
| Massachusetts | $6,694 | $6,764 |
| New York | $6,552 | $5,761 |
| California | $6,413 | $6,235 |
| Washington | $6,510 | $7,213 |
| New Jersey | $6,166 | $6,925 |
| Connecticut | $6,145 | $6,774 |
| Maryland | $6,136 | $6,774 |
| Colorado | $5,997 | $6,444 |
| Virginia | $5,838 | $6,313 |
| Illinois | $5,594 | $5,579 |
| Oregon | $5,559 | $5,856 |
| Minnesota | $5,559 | $6,027 |
| Rhode Island | $5,550 | $6,043 |
| Alaska | $5,511 | $6,876 |
| Delaware | $5,500 | $6,306 |
| New Hampshire | $5,509 | $7,002 |
| Hawaii | $5,420 | $6,562 |
| Arizona | $5,254 | $5,528 |
| Vermont | $5,231 | $5,476 |
| Pennsylvania | $5,160 | $5,577 |
| Georgia | $5,105 | $5,206 |
| Texas | $5,103 | $5,122 |
| Wisconsin | $5,095 | $5,411 |
| Utah | $5,089 | $6,576 |
| Maine | $5,001 | $5,531 |
| Michigan | $5,049 | $5,382 |
| Florida | $5,018 | $5,248 |
| Ohio | $4,990 | $5,135 |
| North Carolina | $4,976 | $5,151 |
| North Dakota | $4,921 | $5,568 |
| Nevada | $4,909 | $5,368 |
| Nebraska | $4,840 | $5,318 |
| Missouri | $4,798 | $4,967 |
| Tennessee | $4,830 | $4,961 |
| Wyoming | $4,827 | $5,156 |
| New Mexico | $4,793 | $4,731 |
| Montana | $4,659 | $5,437 |
| Idaho | $4,637 | $5,732 |
| Kansas | $4,689 | $5,376 |
| Iowa | $4,701 | $5,107 |
| Indiana | $4,701 | $5,029 |
| Kentucky | $4,502 | $4,792 |
| Oklahoma | $4,455 | $4,613 |
| Louisiana | $4,453 | $4,485 |
| Alabama | $4,449 | $4,967 |
| South Carolina | $4,520 | $4,972 |
| South Dakota | $4,436 | $5,322 |
| West Virginia | $4,351 | $4,832 |
| Arkansas | $4,271 | $4,555 |
| Mississippi | $3,964 | $4,296 |
| Source: Sofi.com | ||
States with the Highest Salaries in 2025
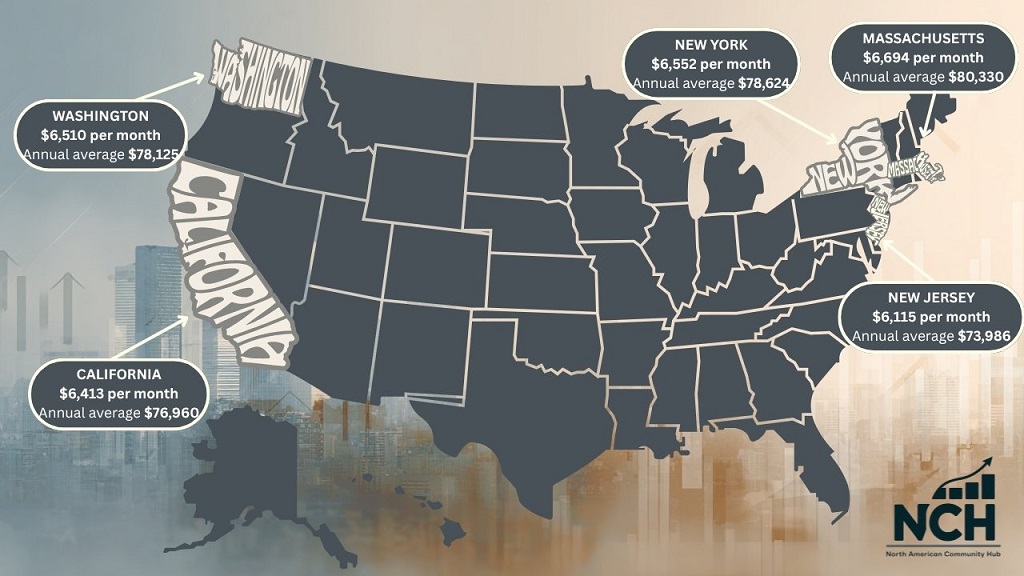
Some states pay far above the national average. The reasons often trace back to high living costs, booming industries, and the concentration of major employers.
Data from the U.S. Bureau of Labor Statistics (BLS) for early 2025 confirms that the biggest paychecks cluster along the East and West Coasts, where skilled workers fill tech, healthcare, and finance roles that drive much of the national economy.
- Massachusetts – about $6,694 per month (annual average $80,330)
- New York – about $6,552 per month (annual average $78,624)
- Washington – about $6,510 per month (annual average $78,125)
- California – about $6,413 per month (annual average $76,960)
- New Jersey – about $6,165 per month (annual average $73,986)
In places like Boston, San Francisco, and Seattle, demand for talent in technology, research, and financial services keeps salaries high. Many residents work in sectors tied to innovation, such as software development, biotech, and green energy. The trade-off is steep rent, higher taxes, and costlier daily life.
Even with those challenges, higher-income states often lead in job satisfaction, career growth, and access to public services. Stronger economies give workers better chances to move up, even if living comfortably takes more careful planning than in lower-cost states.
Where are the Lowest Monthly Salaries in 2025?
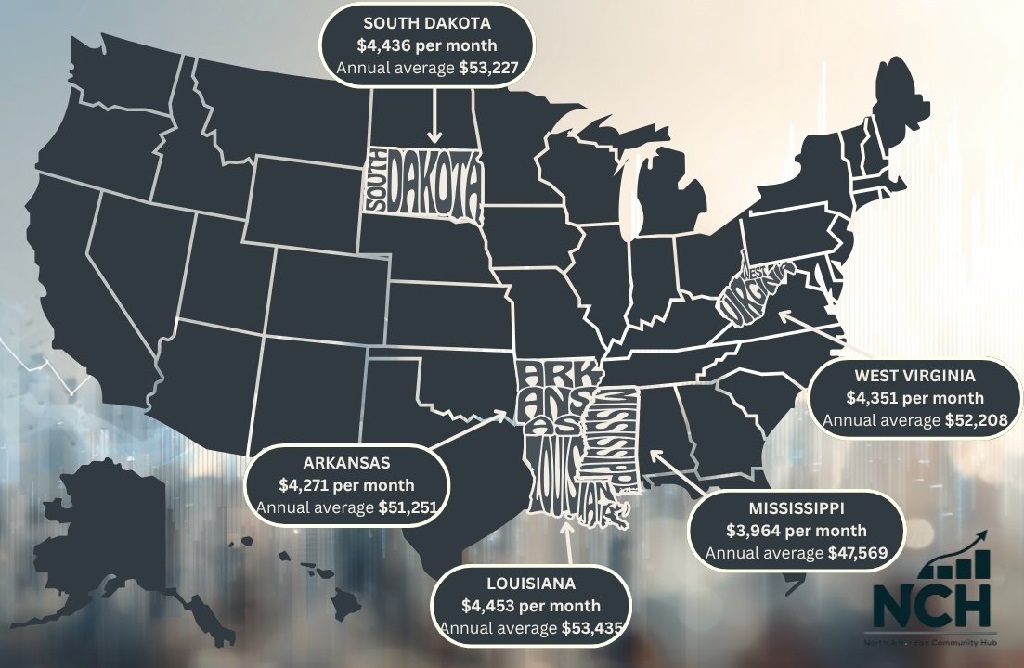
Some states earn far below the national average. Research by Visual Capitalist for 2025 wage mapping shows that regions in the South continue to record the lowest earnings.
Pay levels remain tied to local economies where agriculture, retail, and small manufacturing shape most employment.
- Mississippi – about $3,964 per month (annual average $47,569)
- Arkansas – about $4,271 per month (annual average $51,251)
- West Virginia – about $4,351 per month (annual average $52,208)
- South Dakota – about $4,436 per month (annual average $53,227)
- Louisiana – about $4,453 per month (annual average $53,435)
Workers in these states face smaller paychecks, but daily expenses are also lower. A home in Jackson or Little Rock costs less than half of what the same property would cost in California or New York.
Many families manage steady living standards through affordable housing and lower taxes.
Average Monthly Salary in the US by Age
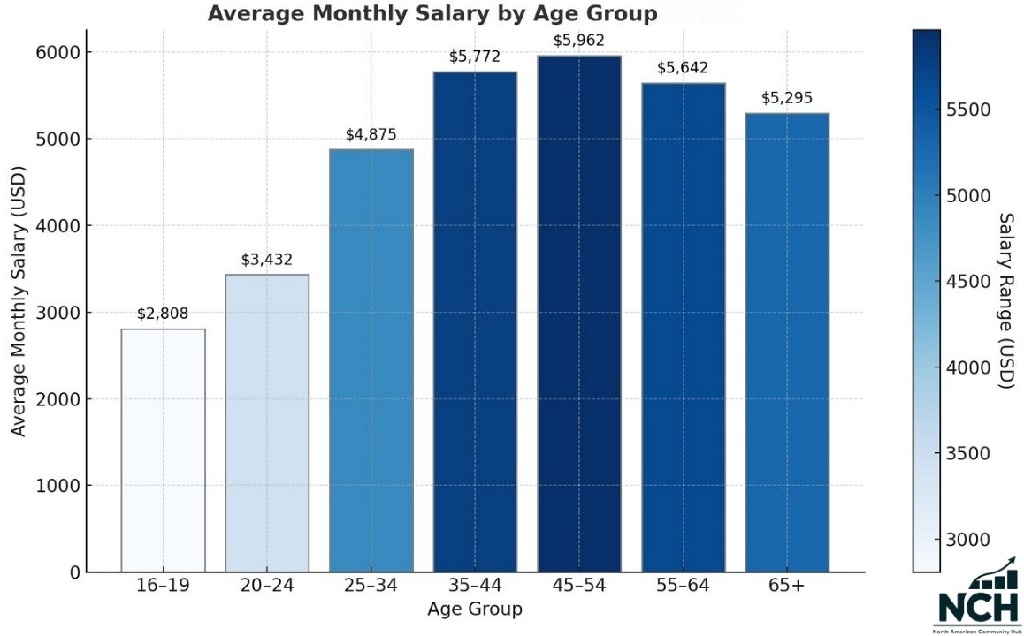
Earnings change with experience, and age plays a major role in how much people make each month.
Data published by Forbes Advisor about average salaries by age shows that income grows steadily through early and mid-career years, then starts to level off as workers approach retirement.
The pattern reflects both job experience and career progress, but also a gradual shift to part-time or consulting work in later life.
- 16 to 19 years – about $2,808 per month
- 20 to 24 years – about $3,432 per month
- 25 to 34 years – about $4,875 per month
- 35 to 44 years – about $5,772 per month
- 45 to 54 years – about $5,962 per month
- 55 to 64 years – about $5,642 per month
- 65 and older – about $5,295 per month
Younger workers tend to start with lower pay as they build skills and job experience. Income rises quickly in the late twenties and early thirties when most people gain stability in their careers.
The highest earnings usually occur between 45 and 54, when experience, leadership roles, and senior positions come together.
After that point, the numbers dip slightly as more workers move into part-time roles or step back from full-time employment.
Still, many in older groups maintain solid incomes through consulting, mentorship, or specialized positions.
Average Salary per Month by Education Level
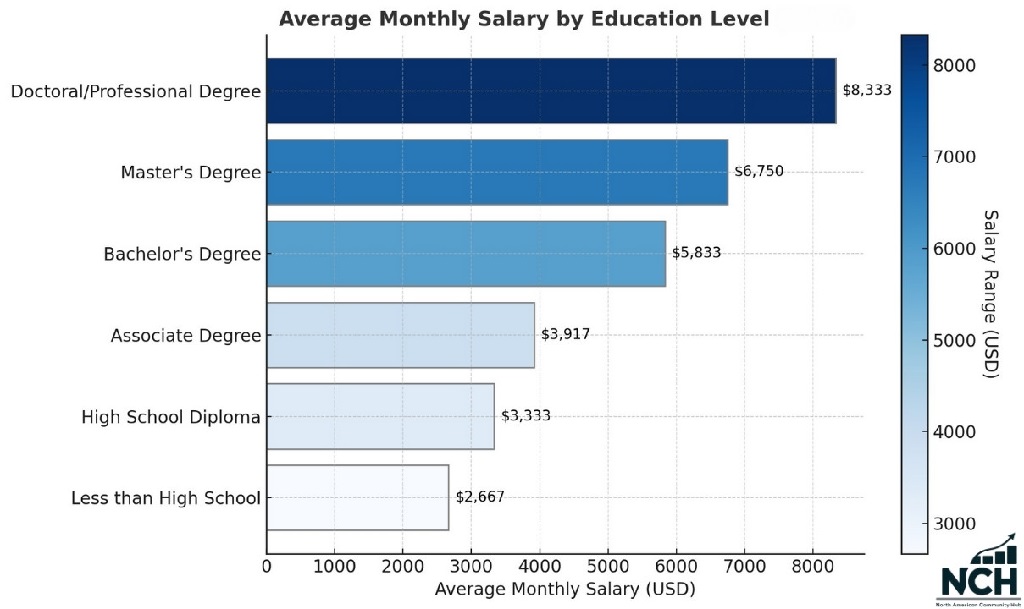
Education continues to play a major role in how much people earn across the United States.
Data from Indeed for 2025 shows a clear link between higher education and higher income. Every step up in schooling brings a steady rise in pay, along with stronger job stability and better long-term prospects.
- Less than high school: $2,667
- High school diploma: $3,333
- Associate degree: $3,917
- Bachelor’s degree: $5,833
- Master degree: $6,750
- Doctoral or professional degree: $8,333
The Indeed data also reveal that people with college or advanced degrees earn nearly twice as much as those without one.
Jobs in engineering, healthcare, and information technology show the biggest difference in pay between education levels.
Average Monthly Salary per Industry in 2025
Industries in the United States show major pay differences. Statista data published in October 2025 highlights how the gap between sectors continues to widen. The report analyzed average hourly earnings across private nonfarm payrolls and adjusted figures for both full-time and part-time workers.
The numbers show a national average of $36.53 per hour, which equals roughly $6,330 per month for a standard full-time schedule. Workers in high-skill sectors such as utilities, information technology, and finance remain the top earners, while employees in retail and hospitality bring in far smaller paychecks.

Here is how the average hourly pay translates into estimated monthly income by industry:
- Utilities – about $9,140 per month
- Information – about $9,120 per month
- Financial activities – about $8,260 per month
- Professional and business services – about $7,720 per month
- Mining and logging – about $7,020 per month
- Construction – about $6,850 per month
- Wholesale trade – about $6,760 per month
- Private education and health services – about $6,160 per month
- Manufacturing – about $6,150 per month
- Other services – about $5,510 per month
- Transportation and warehousing – about $5,500 per month
- Retail trade – about $4,420 per month
- Leisure and hospitality – about $3,990 per month
Source: Statista, 2025.
Higher pay in sectors like information, utilities, and finance reflects strong demand for specialized talent and technical skills. Those industries rely on advanced technology, infrastructure, and analytical expertise, which continue to drive wages upward.
Sectors such as retail and hospitality still employ millions of Americans, but pay less due to limited profit margins and high competition.
Workers in those fields often depend on tips, part-time schedules, or variable shifts, which lowers the monthly income.
Also Read: Richest CEOs in the United States in 2025
Average Monthly Salary per Gender in 2025

Pay differences between men and women remain a defining feature of the U.S. labor market in 2025. Research published by the Pew Research Center in March 2025 reports that women earn about 85% of what men earn when comparing median hourly wages across both full-time and part-time workers. That means for every dollar earned by men, women take home about 85 cents on average.
Younger workers show a smaller gap. Among employees between 25 and 34 years old, women earn about 95 cents for every dollar earned by men in the same age range. That smaller gap reflects growing access to higher education, shifts in hiring practices, and broader progress in management-level representation.
However, the pay difference widens among older groups and across certain professions. Many women remain overrepresented in lower-paying roles in education, care services, and administration. Meanwhile, men continue to dominate higher-paying technical and executive positions.
Pew Research Center attributes much of the long-term narrowing of the gap to better education access and career advancement for women. Yet, the same report notes that treatment by employers and differing expectations around family and caregiving responsibilities still affect women’s earnings.
Even though the wage gap has shrunk over the decades, it continues to shape how households plan finances and how workers measure opportunity in every state.
Average Monthly Salary by Race and Ethnicity in 2025
Pay gaps among racial and ethnic groups in the United States remain a major factor in the national wage picture. Data released by the U.S. Bureau of Labor Statistics for the second quarter of 2025 shows clear differences in median weekly earnings for full-time wage and salary workers across racial and ethnic lines.
White workers continue to record the highest typical earnings outside of Asian Americans, who again lead the national averages. Hispanic and Black workers fall behind those two groups, highlighting the persistence of structural barriers and unequal access to higher-paying industries.
Based on BLS data, the median weekly earnings by group in 2025 stand roughly as follows:
- Asian workers: about $1,759 per week, which equals nearly $7,630 per month.
- White workers: about $1,245 per week, around $5,395 per month.
- Black or African American workers: about $1,040 per week, or about $4,507 per month.
- Hispanic or Latino workers: about $980 per week, or about $4,240 per month.
Those figures underline how access to opportunity and industry placement still shape pay levels. Asian and White workers are more represented in sectors like technology, finance, and management, while Hispanic and Black workers remain concentrated in service and labor roles that pay less.
Education levels, experience, and geographic distribution all play a role, but labor experts emphasize that deeper cultural and policy issues still affect pay equality across racial lines.
How Inflation and Cost of Living Affect Salaries in 2025
Even with rising wages, many Americans still feel behind. A report by Bankrate in August 2025 shows that pay growth has not fully kept up with inflation. Their Wage to Inflation Index reveals a gap of about -1.2 percentage points, meaning prices have grown faster than paychecks since 2021.
Prices have climbed roughly 22.7 percent since the pandemic recovery began, while wages have increased 21.5 percent over the same period. Bankrate analysts note that this small difference means people can afford less, even when earning slightly higher salaries.
Some workers, especially in healthcare, hospitality, and retail, have seen modest gains as demand for labor remains high. Yet many others face shrinking purchasing power in cities where rent, fuel, and grocery prices continue to rise. Experts point out that higher tariffs and a slowing job market also threaten to delay the recovery of real incomes.
Bankrate’s research explains that certain industries have managed to stay ahead of inflation. For example, retail, health care, and food services have seen wages rise faster than prices, while sectors like finance, manufacturing, and education have fallen behind.
How U.S. Salaries Compare to Other Developed Countries
Research from the Economic Innovation Group, written by Jacob Funk Kirkegaard, compared American workers with those in other advanced economies.
The findings use OECD, Eurostat, and Statistics Japan data to measure wages, productivity, and purchasing power across countries.
- U.S. workers earn about $77,500 per year on average, adjusted for purchasing power. Only Luxembourg ($83,300), Switzerland ($82,700), and Iceland ($78,900) report higher adjusted earnings.
- Even in lower-paying states such as Mississippi, adjusted annual wages reach about $59,000, while in New York and Massachusetts, figures exceed $88,000.
- GDP per hour worked in the United States stands at $77 (PPP adjusted), higher than Germany ($69) or Japan ($64).
- The average U.S. household keeps about $63,500 in disposable income after taxes and transfers, more than France ($52,800) or the United Kingdom ($54,200).
- The U.S. interdecile ratio (top 10 percent vs. bottom 10 percent wages) has fallen from 5.7 in 2012 to 4.8 in 2022, showing a gradual narrowing gap.
- American employees work roughly 1,790 hours per year, compared to 1,520 in Germany and 1,440 in Denmark, helping boost total annual income.
Frequently Asked Questions
What is the difference between the average and median salary?
The average salary is calculated by dividing total income by the number of workers. The median salary marks the midpoint of all earners. In 2025, the U.S. average monthly pay is $5,625, while the median is $5,174, based on Bureau of Labor Statistics data. The median better reflects what most people earn, since extremely high incomes raise the average beyond what ordinary workers experience.
How much do remote workers earn in 2025?
According to the FlexJobs Remote Work Index, remote professionals in the United States continue to earn solid incomes despite a 4% quarterly decline in remote job postings. The platform reports that most high-paying remote positions exceed $100,000 per year, including roles such as:
- Senior Product Manager – $135,639 per year
- Senior Data Engineer – $133,748 per year
- Senior Software Engineer – $130,784 per year
- Account Executive – $116,293 per year
- Project Manager – $104,974 per year
FlexJobs also found that 69% of workers would accept lower pay for the ability to work remotely, showing how flexibility is now a key factor in job satisfaction and employment choices.
How much do logistics workers make in 2025?
According to Glassdoor, the median total pay for logistics professionals in the United States is about $77,000 per year. Reported pay ranges between $58,000 and $108,000 annually, depending on experience, role, and company type.
Base pay averages between $43,000 and $79,000, with an additional pay range of $15,000 to $29,000 that includes bonuses and incentives.
The top-paying companies for logistics professionals include:
- Moderna: $129,000 – $240,000
- X (formerly Twitter): $113,000 – $205,000
- Roche: $110,000 – $206,000
Government and public administration roles show the highest median total pay at $87,835, followed by aerospace and defense at $73,600, and information technology logistics at $70,932.
What is the average salary for U.S. military personnel?
Based on U.S. Army Pay Charts for 2025, a full-time enlisted soldier (E2) earns a base salary of $28,356 per year, with total annual compensation reaching $67,285 once housing, food, clothing, and bonuses are included.
Example breakdown for a married Private (E2) stationed at Fort Campbell, KY:
- Base salary: $28,356
- Housing allowance: $21,276
- Food allowance: $5,592
- Clothing allowance: $2,061
- Signing bonus (average): $10,000
- Total annual compensation: $67,285
Senior enlisted ranks, such as Staff Sergeants (E6), earn between $47,000 and $53,000 in base salary, while officers and warrant officers earn significantly higher, depending on years of service.
How much do software developers earn in 2025?
According to U.S. News & World Report (2025), the median annual salary for software developers is $132,270, with most earning between $101,200 and $167,540.
Top-paying states for software developers in 2025 include:
- California: $173,780
- Washington: $159,990
- Maryland: $150,740
- New York: $150,020
- Massachusetts: $146,580
By city, the highest average salaries are reported in:
- San Jose, CA: $199,800
- Boulder, CO: $182,650
- San Francisco, CA: $181,220
- Seattle, WA: $164,130
Bottom Line
Average pay across the United States in 2025 shows progress, but the numbers reveal deep variation. Geography, education, and profession shape how far a paycheck goes.
High-income states like Massachusetts, Washington, and California reward workers with strong wages, yet living costs there erase much of the advantage.
Meanwhile, lower-paying states in the South still manage steadier affordability.
Education continues to prove its worth. Workers with college or advanced degrees earn nearly double compared to those without one. Age and experience also play key roles, with peak earnings coming between 45 and 54 years old.
Across industries, sectors tied to finance, technology, and energy lead in monthly income, while hospitality and retail remain at the lower end.
Despite steady wage growth, inflation continues to pressure real purchasing power.
The data shows that prices have climbed slightly faster than pay since 2021, leaving many households with thinner margins. Yet, global comparisons reveal that American workers still rank among the highest earners worldwide.
Pay gaps across gender, race, and region persist, but opportunities remain strong for skilled and educated professionals.
As industries adapt to new technologies and hybrid work structures, income levels may keep rising, but the cost of living will decide how much that really means for everyday life.