The population growth rate in Alabama currently stands at around 0.26% per year, positioning the state as the 36th fastest-growing in the nation.
Historical Population Trends
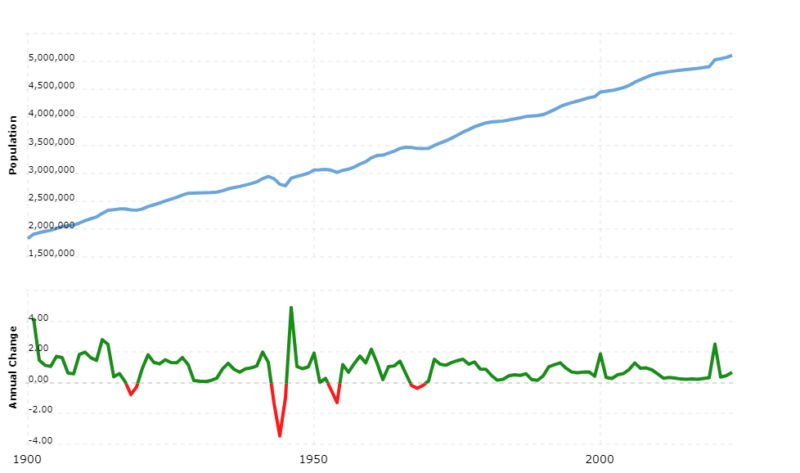
The Alabama population has consistently increased over the decades. In 2023, the population reached approximately 5.14 million, marking a 0.68% increase from the previous year.
The population in 2020 was 5,031,864, representing a significant rise since earlier decades.
The state experienced notable growth rates from 2000 to 2023, adding over 656,971 residents.
Throughout these years, Alabama maintained a relatively moderate growth rate compared to other U.S. states, placing it among the slower-growing regions.
Several elements have historically influenced Alabama’s population trends. Economic opportunities, particularly in industries like manufacturing and aerospace, have attracted individuals to the state. Alabama has also seen growth due to birth rates exceeding death rates in recent years.
Migration plays a crucial role. While many moved to Alabama for work opportunities, others opted for its mild climate and affordable living.
Additionally, shifts in larger urban centers like Huntsville, which grew by over 3,534 residents recently, further contribute to overall trends in state population dynamics, according to AL.
Projected Population Changes

By 2040, Alabama’s population is expected to reach approximately 5.319 million, showing a growth of more than 11% compared to its population in 2010.
However, some counties in Alabama are projected to experience significantly higher growth rates by that time.
According to projections from the Culverhouse School of Business Center for Business and Economic Research at the University of Alabama, based on Census data, the growth rate for each county in Alabama has been forecasted for the period between 2010 and 2040.
| County | Growth Rate (%) | Projected Population (2040) |
|---|---|---|
| Baldwin County | 65.1% | 300,899 |
| Limestone County | 56.6% | 129,617 |
| Lee County | 50.5% | 211,019 |
| Shelby County | 41.7% | 276,373 |
| St. Clair County | 35.3% | 113,123 |
| Madison County | 34.7% | 451,053 |
| Russell County | 33.1% | 70,490 |
| Tuscaloosa County | 26.8% | 246,892 |
| Houston County | 19% | 120,823 |
| Autauga County | 18.7% | 64,771 |
| Elmore County | 18.4% | 93,933 |
| Coffee County | 17.1% | 58,469 |
| Marshall County | 13% | 105,088 |
- Baldwin County is expected to have the highest growth rate at 65.1%, with a projected population of around 300,899.
- Limestone County and Lee County also show significant growth at over 50%.
- Shelby and Madison counties, already some of the more populous counties, will continue to see strong growth rates in the 30-40% range.
- Growth is more moderate in counties like Houston, Autauga, and Coffee, where rates range between 17-19%.
- Marshall County, while still growing, is projected to have the lowest growth among the top 15 counties at 13%.
Factors Affecting Future Population

Alabama’s future population will be shaped by a variety of factors, including economic conditions, migration patterns, birth and mortality rates, and state policies.
Each element plays a crucial role in determining the state’s demographic trajectory and will continuously impact growth or decline.
Economic Conditions
| Metric | Value |
|---|---|
| Alabama GDP Growth Rate (Q1 2024) | 2.9% |
| Alabama GDP Growth Rate (2024 forecast) | 2.6% |
| Alabama Employment Growth (2024 forecast) | 2.0% |
| Net Job Gain (Aug 2023 – Aug 2024) | 43,200 jobs |
| Unemployment Rate (Aug 2023) | 2.5% |
| Unemployment Rate (Aug 2024) | 2.8% |
| Labor Force Participation Rate (Aug 2023) | 57.4% |
| Labor Force Participation Rate (Aug 2024) | 75.5% |
| Total Tax Revenues Growth (Aug 2024 YTD) | 2.3% |
| Sales Tax Receipts Decline (Aug 2024 YTD) | -3.9% |
| Individual Income Tax Revenues Growth | 1.3% |
| Alabama Exports (Jan-Jul 2024) | $15.8 billion |
| Export Growth (Jan-Jul 2024 vs. 2023) | 1.3% |
| Largest Export Destination (Jan-Jul 2024) | China ($2.6 billion) |
| Alabama Imports (Jan-Jul 2024) | $22.8 billion |
| Import Growth (Jan-Jul 2024 vs. 2023) | 8.1% |
| Largest Import Source (Jan-Jul 2024) | Mexico ($4.3 billion) |
Economic Growth
Alabama’s economy continues to show strong growth, with a 2.9% increase in GDP in the first quarter of 2024 and an overall forecast of 2.6% for the year.
According to Culverhouse, this reflects steady economic momentum, although it’s slightly lower than the 4.8% increase seen in the final quarter of 2023.
Employment
While Alabama added 43,200 jobs from August 2023 to August 2024, the unemployment rate ticked up slightly from 2.5% to 2.8%.
Such a rise, combined with an increase in labor force participation from 57.4% to 75.5%, suggests that more people are entering the labor market, potentially outpacing job creation in the short term.
Tax Revenue
Tax revenue growth of 2.3% year-to-date is a positive indicator of the state’s fiscal health, though it is countered by a decline in sales tax receipts (-3.9%), potentially reflecting slower consumer spending or economic shifts.
Trade
Exports grew modestly by 1.3%, with transportation equipment remaining the state’s dominant export.
Notably, China became Alabama’s top export destination. Imports increased by a stronger 8.1%, signaling robust demand for goods, especially from Mexico, South Korea, and Germany.
Migration Patterns
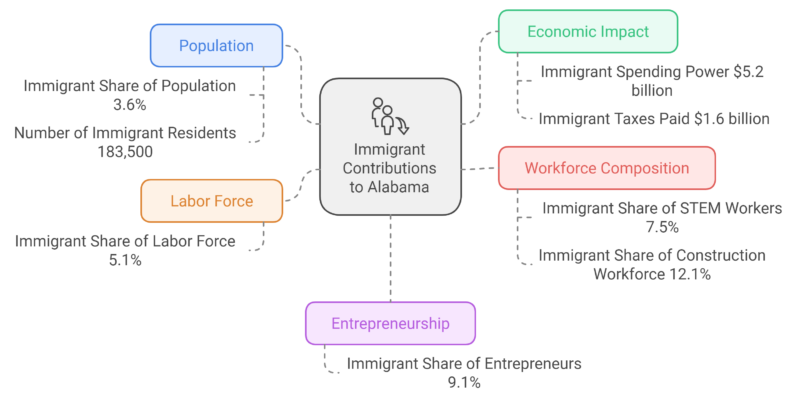
Despite making up only 3.6% of the population, they contribute significantly in terms of spending power ($5.2 billion) and taxes paid ($1.6 billion).
Their involvement in key sectors like STEM (7.5%) and construction (12.1%) is particularly notable, indicating their importance in fields that are critical to the state’s infrastructure and technological development.
Family and Demographics of Alabama’s Immigrant Population
| Metric | Value |
|---|---|
| Share of U.S.-Born Population with Immigrant Parent | 2.4% |
| Number of U.S.-Born Residents with Immigrant Parents | 116,000 |
| Number of Immigrant Children | 12,300 |
| Share of Immigrant Women | 51.4% |
| Share of Immigrant Men | 48.6% |
While 2.4% of the state’s U.S.-born population has at least one immigrant parent, this represents a significant number of people—116,000.
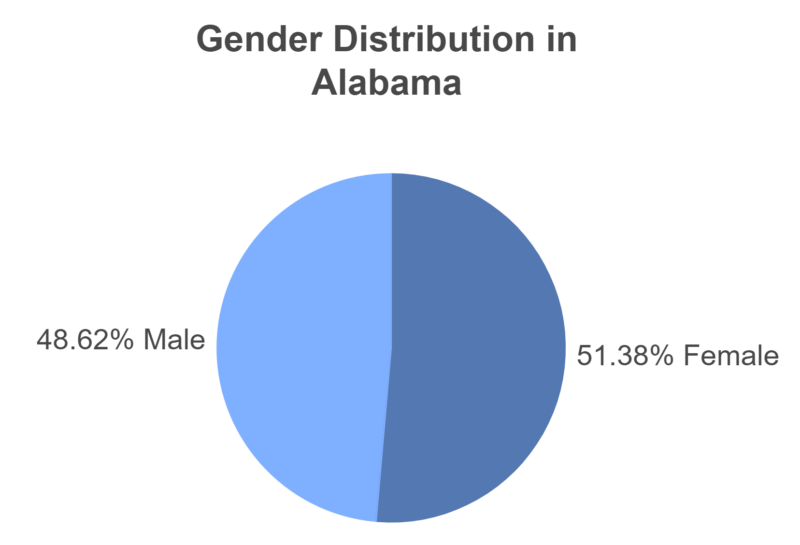
Additionally, the nearly even gender distribution (51.4% women, 48.6% men) shows a balanced demographic among immigrant residents, which reflects a diverse and family-oriented immigrant community in the state, according to the American Immigration Council.
Age Group Comparison of Immigrant vs. U.S.-Born Populations
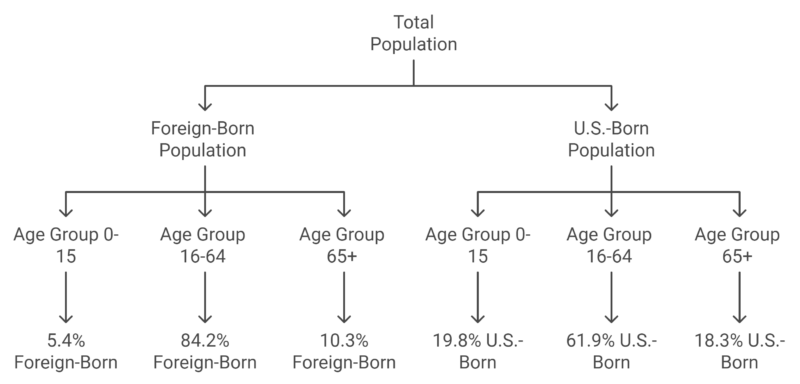
Immigrants in Alabama tend to be of working age, with 84.2% of the immigrant population between 16-64 years old, compared to 61.9% of U.S.-born residents in the same age group.
This shows that the immigrant population is more economically active, likely contributing heavily to the state’s workforce and economic productivity.
Conversely, a smaller percentage of immigrants are children or seniors compared to the U.S.-born population, which further highlights their active economic role.
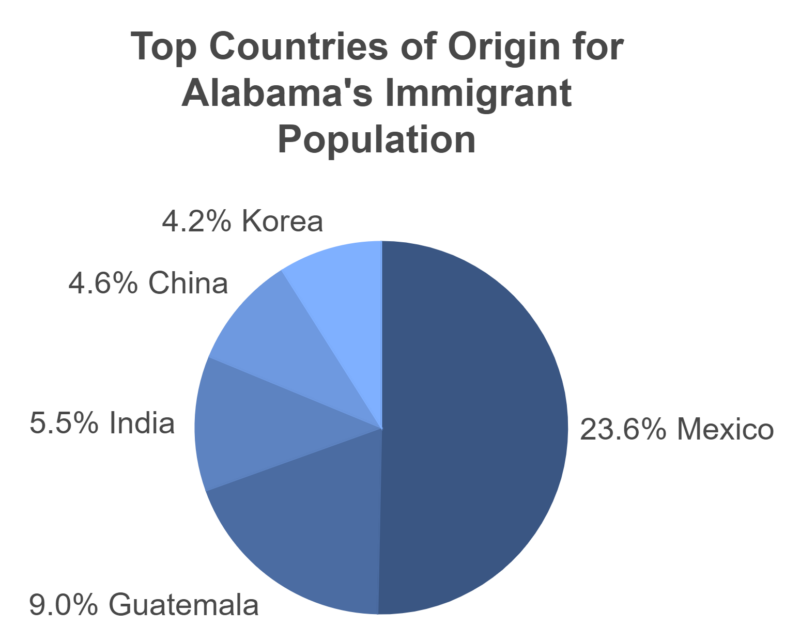
Top Countries of Origin
A significant 81.4% of Alabama’s immigrant population is proficient in English, which enhances their ability to integrate into the state’s economy and society.
Mexico is the largest country of origin for immigrants in Alabama (23.6%), followed by Guatemala (9.0%), India (5.5%), China (4.6%), and Korea (4.2%).
This diversity brings a wide range of cultural and economic contributions to Alabama, enriching local communities and industries with varied skills and experiences.
Birth and Mortality Rates
| Indicator | Value |
|---|---|
| Fertility Rate | 58.7 births per 1,000 women (15-44 years) |
| Teen Birth Rate | 20.9 births per 1,000 females (15-19 years) |
| Infant Mortality Rate | 6.69 infant deaths per 1,000 live births |
| Life Expectancy (at Birth) | 72.0 years (2021) |
| Marriage Rate | 7.3 marriages per 1,000 people |
| Divorce Rate | 3.2 divorces per 1,000 people |
| Leading Cause of Death | Heart Disease |
| Drug Overdose Death Rate | 31.5 per 100,000 |
| Firearm Death Rate | 25.5 per 100,000 |
Alabama’s health indicators show some significant challenges. The state’s life expectancy of 72.0 years is lower than the national average, suggesting healthcare and lifestyle issues. The leading cause of death, heart disease, highlights the need for better cardiovascular health initiatives.
High rates of drug overdose deaths (31.5 per 100,000) and firearm deaths (25.5 per 100,000) reflect social and public health concerns. The teen birth rate (20.9 per 1,000) and infant mortality rate (6.69 per 1,000 live births) are areas of concern, as these rates are often higher than national averages according to the CDC.
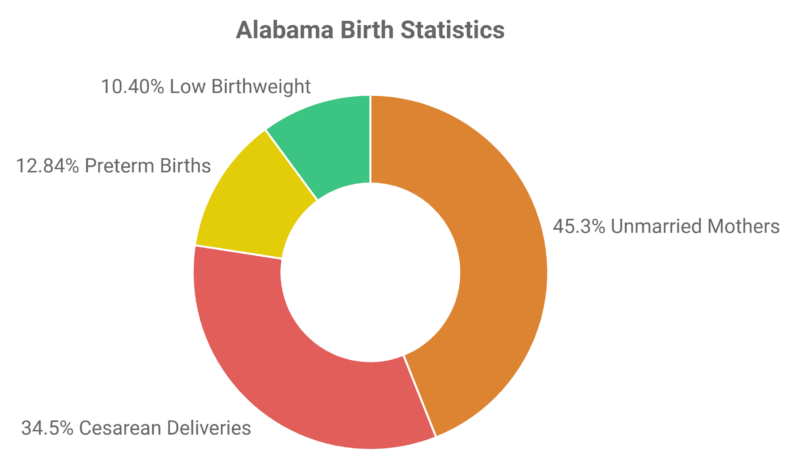
Alabama’s birth data indicate some areas that may need attention. A large percentage of births (45.3%) are to unmarried mothers, which can sometimes be associated with economic and social support challenges.
The cesarean delivery rate (34.5%) is relatively high, and this may reflect both medical practices and healthcare access. The preterm birth rate (12.84%) and low birthweight rate (10.40%) are higher than ideal, pointing to issues that could relate to prenatal care, maternal health, and socio-economic factors affecting pregnant women.
Housing
| Metric | Value |
|---|---|
| Total Home Sales | 5,974 |
| Month-Over-Month Change in Sales | -2.6% |
| Year-Over-Year Change in Sales | +0.66% |
| Median Sales Price | $235,575 |
| Month-Over-Month Change in Median Price | +1.0% |
| Year-Over-Year Change in Median Price | +1.5% ($3,375 increase) |
| Total Sold Volume | $1.49 billion |
| Month-Over-Month Change in Sold Volume | -1.3% |
| Year-Over-Year Change in Sold Volume | +6.4% |
| Active Listings (End of August) | 18,136 |
| Month-Over-Month Change in Active Listings | +4.4% |
| Year-Over-Year Change in Active Listings | +41.9% |
| Total Foreclosures | 441 |
| Month-Over-Month Change in Foreclosures | -1.3% |
| Year-Over-Year Change in Foreclosures | -1.8% |
- Sales Volume: August 2024 saw 5,974 home sales, a 2.6% decline from July, marking the first drop in six months after continuous growth. However, compared to last year, sales have increased by 0.66%, indicating a stable but cooling market as per Alabama Realtors.
- Prices: The median home price reached $235,575, up 1.0% month-over-month and 1.5% year-over-year. This marks the highest price level since August 2022, showing steady growth in home values despite the slight drop in sales volume.
- Market Activity: The total sold volume decreased slightly by 1.3% month-over-month to $1.49 billion, but it is still 6.4% higher compared to last year, demonstrating a robust market with higher-priced transactions. The number of active listings surged by 4.4% compared to July, and by a significant 41.9% year-over-year, indicating a more competitive market with more homes available for buyers.
- Foreclosures: Foreclosure rates continue to decline, with a 1.3% drop from July and a 1.8% decrease from last year. The sustained decrease in foreclosures suggests fewer financial difficulties among homeowners, reflecting broader economic stability.
State Budget and Allocation
Catalyst will keep us energized and in the game as the future brings new challenges.
It’s important that we remain competitive for projects that create good jobs and inject vitality into our communities. #alpolitics (2/2)https://t.co/ItydoWRXK1
— Governor Kay Ivey (@GovernorKayIvey) October 1, 2024
Governor Kay Ivey received a new strategic economic plan for Alabama, called Catalyst, from Commerce Secretary Ellen McNair. This plan aims to drive the state’s long-term growth over the next decade, replacing the Accelerate Alabama framework that generated $67 billion in investment and nearly 170,000 jobs since 2012.
The Catalyst initiative focuses on modernizing Alabama’s economic development strategy to prepare for the 2030s, emphasizing technological adaptation, human capital development, entrepreneurship, and rural growth.
The plan highlights key sectors such as automotive and aerospace mobility, defense, chemical manufacturing, agriculture, bioscience, and technology. It also identifies business services and logistics as critical growth enablers. Quality placemaking, including leveraging outdoor recreation, will be a key part of enhancing community appeal.
McKinsey & Company provided analytical support for Catalyst’s development and will assist with the Alabama Growth Alliance to foster collaboration between the public and private sectors. The plan developed through a collaborative process involving over 400 stakeholders and multiple workshops positions Alabama to adapt to a changing global economy and maintain its competitiveness.
Educational System
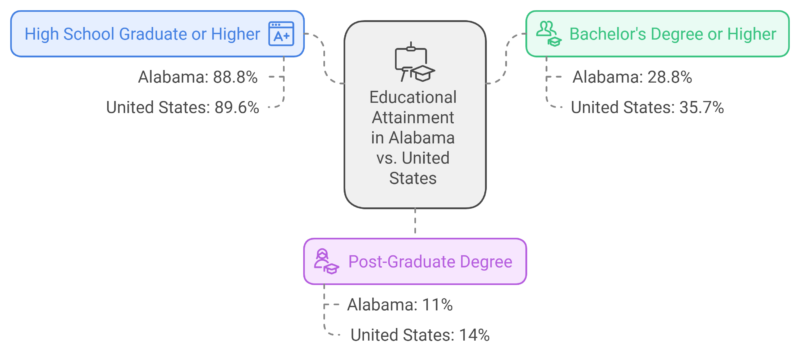
Census Reporter notes that Alabama’s rate of high school graduates (88.8%) is close to the national average (89.6%), indicating a strong foundation in basic education. However, the state lags behind in higher education attainment.
Only 28.8% of the population has a bachelor’s degree or higher, about 80% of the U.S. average (35.7%). The gap widens further at the post-graduate level, where only 11% of Alabama residents have advanced degrees compared to 14% nationwide.
Population by Highest Level of Education in Alabama
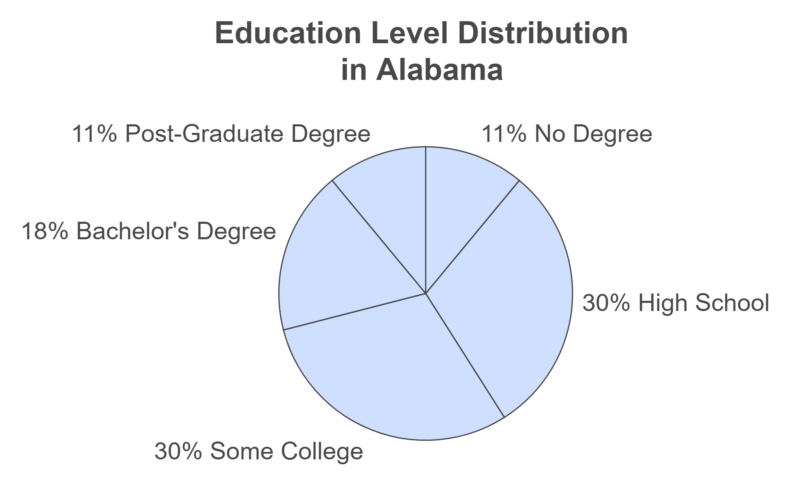
The largest segments of Alabama’s population have either a high school diploma (30%) or some college experience (30%), showing that while many residents pursue further education, fewer complete a bachelor’s degree (18%) or higher.
The relatively low levels of post-graduate degrees (11%) suggest that more focus on advanced education and professional development could benefit Alabama’s workforce and economic growth in the future.
Healthcare
| Strengths | Challenges |
|---|---|
| Low prevalence of excessive drinking | Low percentage of households with high-speed internet |
| Low housing cost burden | High risk of social isolation |
| High percentage of older adults with a dedicated healthcare provider | High prevalence of physical inactivity |
Alabama has several strengths in senior health, such as a low prevalence of excessive drinking and a high percentage of older adults with a dedicated healthcare provider.
However, the state faces challenges like limited access to high-speed internet, increasing social isolation, and a high prevalence of physical inactivity, which could affect seniors’ overall well-being, as noted by America’s Health Rankings.
| Metric | 2021 Value | 2022 Value | Percentage Change |
|---|---|---|---|
| Depression (65 and older) | 13.8% | 18.3% | +33% |
| Smoking (65 and older) | 12.3% | 9.1% | -26% |
| Early Deaths (ages 65-74, per 100,000 adults) | 2,928 | 2,581 | -12% |
While smoking rates among Alabama seniors decreased by 26%, signaling improved health habits, depression rates rose significantly by 33%, indicating growing mental health concerns among seniors. The decrease in early deaths by 12% suggests some progress in senior health, possibly due to improved healthcare access or lifestyle changes.
Disparities in Alabama Senior Health
| Disparity Metric | High-Risk Group | Low-Risk Group | Difference (Times Higher) |
|---|---|---|---|
| Full-mouth teeth extractions | Seniors with less than high school education (38.2%) | Seniors with a college degree (4.6%) | 8.3x |
| Firearm Death Rate (per 100,000 adults) | Men (38.9) | Women (4.9) | 7.9x |
| Frequent Mental Distress (65 and older) | Seniors with self-care difficulties (28.6%) | Seniors without disabilities (4.3%) | 6.7x |
There are significant health disparities among seniors in Alabama. Those with less education are 8.3 times more likely to experience full-mouth teeth extractions, which may reflect socioeconomic barriers to dental care.
Men face a much higher firearm death rate than women (7.9 times higher), and seniors with self-care difficulties are far more likely to experience frequent mental distress, indicating a need for targeted support for these vulnerable groups.
Alabama Crime Statistics (2025)
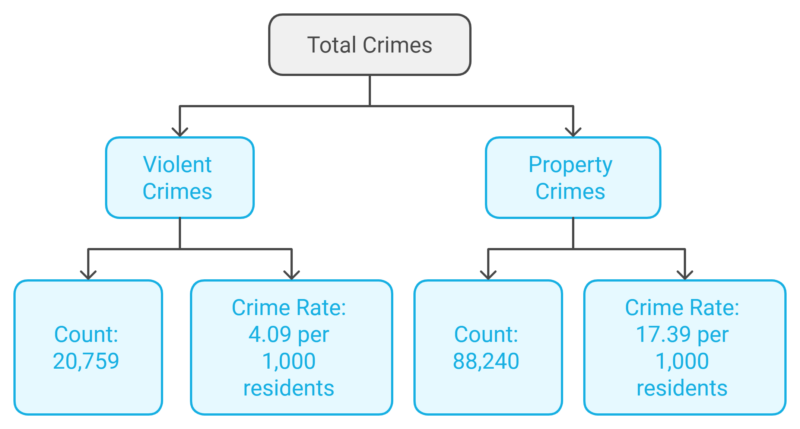
Alabama experiences a total crime rate of 21.48 crimes per 1,000 residents, with property crimes being significantly more prevalent than violent crimes. Violent crime rates (4.09 per 1,000) are much lower compared to property crimes (17.39 per 1,000), indicating that property-related offenses make up the majority of the criminal activity in the state according to Neighborhood Scout.
Violent Crime
| Crime Type | Number of Crimes | Rate per 1,000 Residents |
|---|---|---|
| Murder | 552 | 0.11 |
| Rape | 1,504 | 0.30 |
| Robbery | 1,750 | 0.34 |
| Assault | 16,953 | 3.34 |
Assault is by far the most common type of violent crime in Alabama, with a rate of 3.34 per 1,000 residents, while murder rates remain much lower at 0.11 per 1,000. This reflects a pattern where most violent crime involves physical assaults rather than more severe crimes like murder or robbery.
Property Crime
| Crime Type | Number of Crimes | Rate per 1,000 Residents |
|---|---|---|
| Burglary | 14,408 | 2.84 |
| Theft | 63,566 | 12.53 |
| Motor Vehicle Theft | 10,266 | 2.02 |
Theft is the most common type of property crime in Alabama, with a rate of 12.53 per 1,000 residents, far surpassing burglary and motor vehicle theft. This suggests that personal property crimes, such as theft, are a significant concern in the state, while burglary and vehicle theft occur less frequently but still contribute to the overall property crime rate.
Chances of Becoming a Victim in Alabama
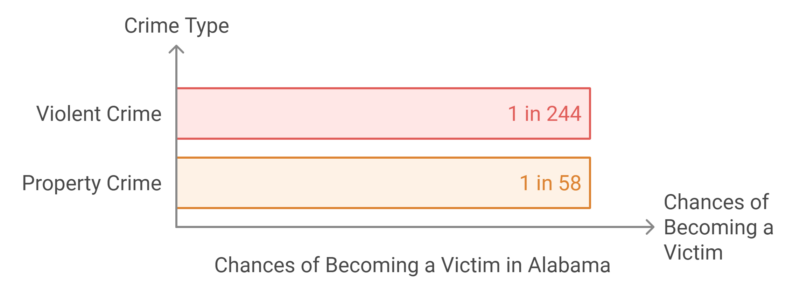
In Alabama, residents are much more likely to become victims of property crime than violent crime, with a 1 in 58 chance of encountering a property crime compared to a 1 in 244 chance for violent crime. These odds reflect the relatively high prevalence of theft and other property-related offenses in the state.
Interesting Insight: Alabama is one of 4 states in the US that start with the letter A.
Bottom Line
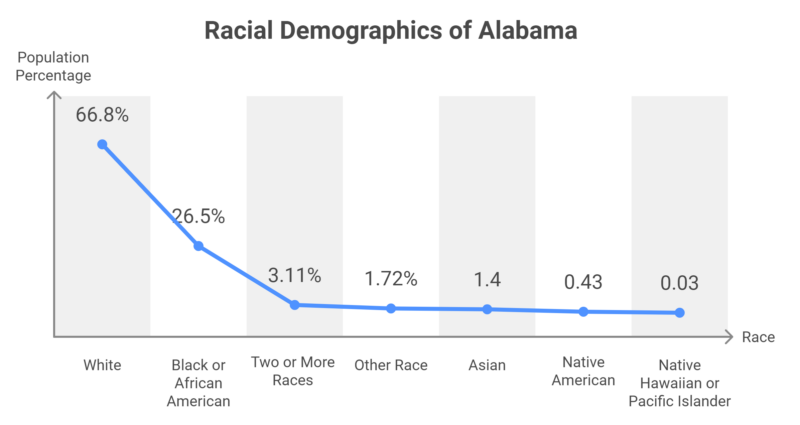
Alabama continues to experience steady population growth, with projections pointing to more than 5.3 million residents by 2040. The state’s demographic structure reveals an aging population, moderate racial diversity, and a strong reliance on working-age immigrants.
Economic forecasts highlight stable GDP expansion, job creation, and increased trade activity, supported by new initiatives like the Catalyst plan. However, challenges remain in healthcare, education, and crime prevention.
Counties such as Baldwin, Limestone, and Lee are set to drive future growth, reshaping regional dynamics. Overall, Alabama’s population trends and economic indicators suggest gradual but consistent progress, balanced by pressing social and health issues that will shape its long-term trajectory.
Methodology
- Data for Alabama’s population, economy, healthcare, education, and crime statistics were sourced from reliable public databases such as World Population Review, America’s Health Rankings, U.S. Census Bureau, and Alabama Demographics.
- Population and demographic trends were compiled from 2025 estimates and future projections through Neilsberg and Macrotrends, with county-level data drawn from Alabama Demographics.
- Economic indicators, including GDP and employment, were gathered from the Alabama Department of Commerce and the U.S. Bureau of Economic Analysis.
- Health data, including life expectancy and birth rates, was sourced from America’s Health Rankings and the CDC.
- Crime statistics were obtained from Neighborhood Scout and FBI Uniform Crime Reports, focusing on violent and property crime rates.
- All data was cross-referenced to ensure accuracy and consistency across multiple sources.