In 2025, the average U.S. household pays about $590 per month for essential utilities, including electricity, natural gas, water/sewer, waste and recycling, internet/cable, and phone services.
According to the latest analysis by This Old House (2025), Connecticut tops the nation with an average monthly utility bill of $794, while Idaho households spend the least, at $495. This wide gap – nearly $300 between the most and least expensive states – shows how geography, infrastructure, and local energy sources shape monthly household budgets.
For context, a parallel 2025 study by RentCafe puts renter utility costs at around $444 per month, reflecting smaller living spaces and different usage patterns. Taken together, the data show that utilities remain one of the largest recurring expenses in the American household budget.
The U.S. National Utility Picture in 2025
Breaking down the nationwide average gives us a clearer sense of what drives household costs. According to aggregated data from the Energy Information Administration (EIA), the American Gas Association (AGA), and consumer billing reports:
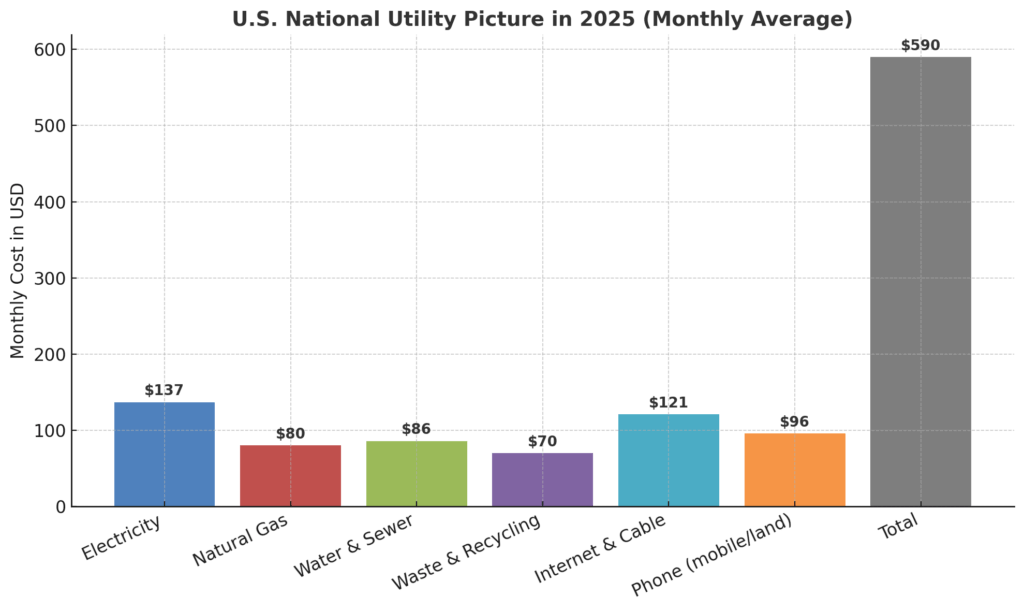
Electricity remains the single largest line item, accounting for almost a quarter of the average bill. But internet and phone services together rival traditional energy costs, showing how digital connectivity has become an essential “utility” in modern life.
States by Average Monthly Utility Bills (2025)
| Rank | State | Avg. Monthly Utility Bill (2025) |
| 1 | Connecticut | $794 |
| 2 | Maryland | $782 |
| 3 | Maine | $733 |
| 4 | Alaska | $727 |
| 5 | Massachusetts | $723 |
| 6 | Rhode Island | $712 |
| 7 | Vermont | $698 |
| 8 | New Hampshire | $687 |
| 9 | New York | $676 |
| 10 | New Jersey | $674 |
| 11 | California | $663 |
| 12 | Hawaii | $661 |
| 13 | Pennsylvania | $658 |
| 14 | Illinois | $645 |
| 15 | Michigan | $642 |
| 16 | Wisconsin | $633 |
| 17 | Minnesota | $631 |
| 18 | Oregon | $628 |
| 19 | Washington | $624 |
| 20 | Colorado | $617 |
| 21 | Nevada | $615 |
| 22 | Arizona | $610 |
| 23 | North Carolina | $608 |
| 24 | Georgia | $606 |
| 25 | Virginia | $605 |
| 26 | Kentucky | $601 |
| 27 | Ohio | $598 |
| 28 | Indiana | $595 |
| 29 | Missouri | $593 |
| 30 | Tennessee | $589 |
| 31 | South Carolina | $584 |
| 32 | Alabama | $582 |
| 33 | Texas | $581 |
| 34 | Louisiana | $578 |
| 35 | Kansas | $574 |
| 36 | Oklahoma | $570 |
| 37 | Arkansas | $566 |
| 38 | Nebraska | $560 |
| 39 | North Dakota | $556 |
| 40 | South Dakota | $551 |
| 41 | Montana | $548 |
| 42 | Mississippi | $543 |
| 43 | Wyoming | $538 |
| 44 | New Mexico | $517 |
| 45 | West Virginia | $508 |
| 46 | Iowa | $507 |
| 47 | Utah | $502 |
| 48 | Idaho | $495 |
| — | District of Columbia | ~$670 |
Regional Analysis

The Northeast: Expensive Energy and High Water Costs
The Northeast dominates the top 10. Connecticut, Massachusetts, Rhode Island, and New York all rank near the highest because electricity is costly, and natural gas must often be piped long distances.
Water and sewer charges are also some of the highest in the nation. For example, Maryland averages nearly $190 per month just for water and sewer. Older housing stock with less insulation also drives up heating bills in winter.
The West Coast & Hawaii: Energy Pricing + Internet Costs
@linguamarina Utility bills in California 😜 how much do you pay? #california #losaltos #usa #utility #familyfinance ♬ original sound – Marina Mogilko
California and Hawaii both face high electricity costs. Hawaii, in particular, leads the nation in electric bills, averaging over $210 per month, due to reliance on imported fuel.
California’s totals are inflated by regulatory fees and larger homes that consume more energy.
Internet and cable costs are also higher than the national average across the Pacific and coastal states, which explains why many households are exploring satellite internet providers as alternatives to traditional cable, especially in rural California and island communities where wired broadband is limited or overpriced.
The Midwest: A Mixed Bag
In states like Illinois, Michigan, and Wisconsin, utilities are mid-range, typically $630–650 per month. Harsh winters drive up heating costs, but abundant natural gas keeps prices somewhat lower than in the Northeast.
Iowa, however, stands out as one of the cheapest states in the country at just $507 per month, largely because of strong renewable energy investments in wind power and cheaper housing.
The South: Moderate Costs but Rising Cooling Bills
Southern states like Georgia, Texas, Alabama, and South Carolina fall close to the national average.
Electricity is relatively affordable, but long, hot summers mean air conditioning drives up overall usage. Water and sewer fees are also lower than in the Northeast, keeping totals in the $580–610 range.
The Mountain West: Lowest in the Nation
Idaho, Utah, New Mexico, and Wyoming are among the cheapest states, all under $540 per month.
Idaho leads as the most affordable at just $495, thanks to cheap hydropower and mild seasonal swings compared to the Midwest. Utah also benefits from abundant renewable resources and lower housing density.
Component-Level Extremes: What Really Drives Bills
View this post on Instagram
Utility bills are not a single line item; they’re the sum of several services that vary by state. Breaking them down shows why some households face double the costs of others.
Electricity Costs: A Geography-Driven Divide
Electricity is the single largest monthly utility expense nationwide, averaging $137 per month. But in 2025, the spread is dramatic. Hawaii tops the nation at $213, largely because the islands import most of their fuel, making generation expensive. Connecticut follows at $203, driven by reliance on natural gas plants and costly transmission networks.
By contrast, Utah households average only $85 per month. The state benefits from cheap hydropower, a growing share of solar energy, and a relatively modern housing stock that uses energy more efficiently. Electricity cost gaps alone can swing a household’s annual budget by over $1,500, depending on where they live.
Water & Sewer Charges: Hidden but Heavy
While electricity is often the focus, water and sewer charges can quietly rival energy costs. Maryland households pay an average of $189 per month, the highest in the country, reflecting aging infrastructure and the cost of upgrading urban water systems.
By comparison, households in Alabama and Tennessee pay just $55 per month, thanks to abundant freshwater access and lower regulatory fees.
This difference is often overlooked but matters greatly for families. A family of four moving from Birmingham, AL, to Baltimore, MD, can expect to pay $1,600 more per year for water services alone.
Waste & Recycling: The Policy Effect
Garbage collection and recycling fees also vary widely. In Massachusetts and Maryland, households average about $127 per month. These states rely heavily on municipal contracts and stricter environmental rules, which drive up service costs.
Rural Midwestern states, where landfills are more accessible and services less centralized, often see waste bills under $50 per month.
This demonstrates how local policy and environmental commitments – not just geography – shape costs.
Utilities in the Context of Household Budgets

According to Seeking Alpha, the median household income is $83,150 annually.
The National Burden
At an average of $590 per month, utilities consume roughly 9% of the typical U.S. household budget. That’s nearly equal to what the average household spends on groceries in a month.
High-Cost States: When Utilities Eat Into Affordability
In high-cost states like Connecticut and Massachusetts, utilities climb above $720 per month. This pushes the utility share of household income past 12%, meaning utilities take a larger bite than transportation or healthcare in many family budgets.
For lower- and middle-income households, this can make the difference between financial stability and hardship.
Low-Cost States: Breathing Room in the Budget
In contrast, households in Idaho, Utah, and Iowa pay closer to $500 per month, or about 7% of income.
While this is still significant, it frees up several thousand dollars annually compared to the Northeast, which can be redirected to savings, housing, or discretionary spending.
Renters vs. Homeowners
Renters typically spend less – about $444 per month on utilities, according to RentCafe (2025). Apartments often share walls, reducing heating and cooling costs, and have fewer square feet to maintain.
However, renters are more exposed to sudden rent hikes that roll utilities into higher monthly payments.
Rising Costs: Energy Inflation and Broadband
Even though U.S. households are using more efficient appliances, costs have risen faster than wages. Energy inflation has been fueled by fuel supply constraints, while broadband and cable fees now make up nearly one-third of the total utility bill in some states.
This means households are saving energy but still paying more overall, creating a squeeze that affects both renters and homeowners alike.
Final Words

Utility bills are no longer just background expenses; they are central to the housing affordability crisis. Families looking to relocate often compare rent or mortgage costs without factoring in utilities, yet the difference between $794 in Connecticut and $495 in Idaho can outweigh a modest difference in rent.
As experts note, “utilities have become the hidden cost of living,” and in 2025, they now represent a larger share of disposable income than a decade ago.
Policymakers increasingly frame utility reform – through renewable energy expansion, water infrastructure investment, and broadband regulation – as a necessary step in tackling the affordability gap.