Canada and the United States share a border, trade routes, media space, and a long list of cultural similarities. Healthcare is not one of them. The two countries built systems that feel familiar on the surface but behave very differently once real people start booking appointments, filling prescriptions, and opening medical bills.
Anyone who has lived in both places, or has family spread across the border, usually has a few stories that explain the difference faster than any policy paper ever could.
One system centers public insurance around a national framework and treats hospital and physician care as a shared social service. The other relies on a web of private plans, government programs, and personal spending.
Each model shapes how care feels, how fast it moves, what people pay, and what kind of outcomes show up at a population level.
Today, we prepared a comparison based on coverage design, financing, access, patient costs, and health outcomes, using verified national data and current reporting.
The Core Structure Of Each System
Let’s see how each country organizes, funds, and administers healthcare at the structural level, which ultimately shapes access, costs, and patient experience.
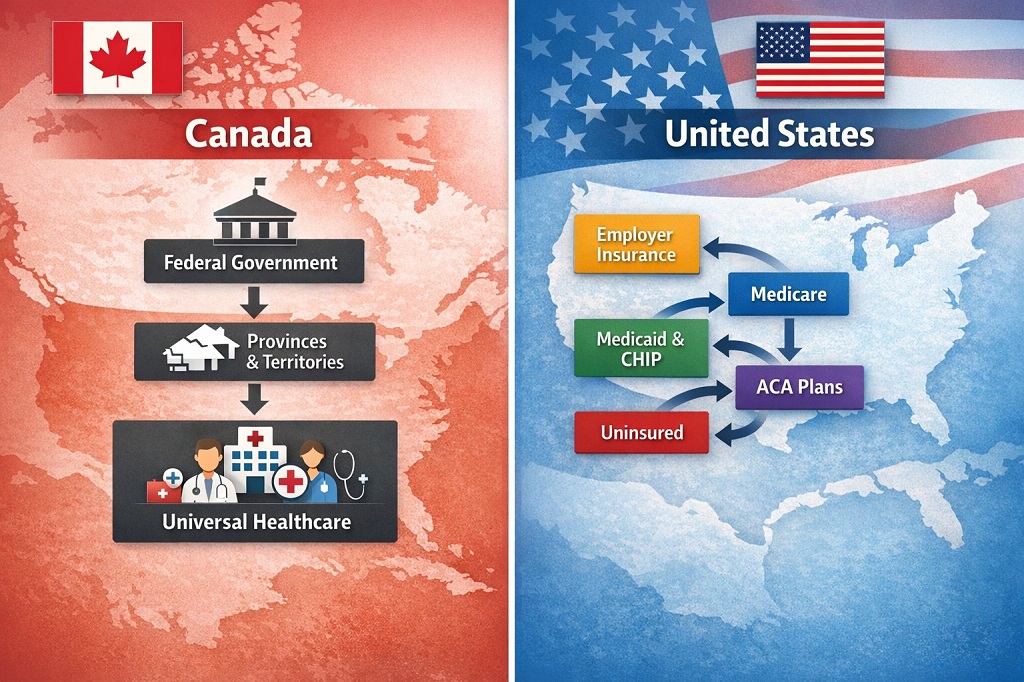
Canada – Single Public Payer For Core Medical Care
Canada runs what many residents simply call Medicare. It is a publicly funded insurance system delivered through provincial and territorial health plans.
The Canada Health Act sets national conditions that provinces must meet to receive full federal health transfers. Those conditions define what qualifies as insured medical care and protect public access rules.
The insured service basket centers on:
- Hospital services
- Physician services
- Certain surgical dental services
Provinces manage operations, budgets, and provider payment models. The federal government supports funding through the Canada Health Transfer.
For medically necessary hospital stays and physician visits, patients usually do not receive a bill at point of care.
Outside that hospital and physician core, coverage depends on provincial programs, employer benefits, and personal spending.
United States – Multi-Payer And Multi-Market
The United States operates a fragmented model built from several major channels:
- Employer-sponsored insurance
- Medicare for older adults and certain disabilities
- Medicaid and CHIP for lower-income groups
- ACA Marketplace plans
- Military and other public coverage
- A remaining uninsured population
OECD data places core coverage at about 93% of residents. Coverage terms, costs, and access rules depend heavily on plan type, state policy, income, and employer decisions. Insurance cards may look similar across the country, yet benefits and bills can feel very different.
What Gets Covered And What Does Not
Here, we’ll explain which medical services fall under public insurance in both countries and which ones typically rely on private plans or personal payment.
Canada’s Core Basket And Its Gaps

Canada’s insured services focus on hospital and physician care. Many everyday needs fall outside that basket and rely on private insurance or out-of-pocket payment.
Patients seeking elective aesthetic procedures, including consultations with a top plastic surgery service, usually rely on private clinics and direct payment.
Common gaps include:
- Outpatient prescription drugs
- Routine dental care
- Routine vision care
- Many allied health services, such as physiotherapy or private psychology
- Parts of home care and long-term care, depending onthe province
OECD figures show that mandatory public financing covers 70% of Canadian health spending. The remaining share flows through private insurance and household payments.
Federal policy has started filling some of those gaps. A national dental care program now supports eligible groups, and new pharmacare legislation signals movement toward more standardized drug coverage across provinces.
US Coverage Includes More Categories But With Cost Sharing
Most US health plans include prescription drugs, mental health care, hospital services, and physician care. Dental and vision are often sold separately.
The practical tradeoff is complexity and cost sharing:
- Monthly premiums
- Annual deductibles
- Copays and coinsurance
- Network restrictions
- Prior authorization rules
Employer family coverage premiums have reached about $26,993 per year, with workers paying a meaningful share of that cost. Deductibles remain common, which shapes how households decide when and where to seek care.
National surveys show that affordability still blocks access for many insured adults who delay visits, skip prescriptions, or struggle with medical bills.
How Each System Is Financed
Funding structures shape how care is delivered, what households pay, and how sustainable each healthcare system remains over time.
Canada – Taxes And Public Budgets
Funding flows mainly through general taxation at provincial and federal levels. The Canada Health Transfer represents the largest federal health payment to provinces and territories, delivered on an equal per capita basis.
CIHI projects total Canadian health spending at $372 billion in 2025, or about $9,054 per person. Public financing covers the majority of that amount, while private insurance and direct payments fill in the rest.
United States – Premiums, Taxes, And Higher Prices
US financing splits across:
- Employer and employee premiums
- Federal and state taxes for Medicare and Medicaid
- Household out of pocket spending
OECD places US per capita health spending at $14,885 and 17.2% of GDP. That level stands far above peer countries.
National accounting by CMS measures total spending in the trillions. Higher prices, administrative overhead, and fragmented insurance pools play major roles in overall cost levels. Medical debt remains a visible downstream effect.
Access To Care And Wait Times
Access to care and wait times shape how quickly people move from first symptoms to real treatment, and they reveal where each system feels smooth, strained, or financially blocked.
Canada – Universal Entry With Capacity Limits
Universal coverage ensures entry into the system. The main pressure point shows up in timelines for specialist visits, imaging, and elective surgery.
Recent national data on specialist access shows:
- 35% waited under 1 month
- 30% waited 1 to under 3 months
- 36% waited 3 months or more
Only 49% of people reported satisfaction with wait times. Longer waits were linked to anxiety, pain, and difficulty performing daily activities.
CIHI procedure data adds detail:
- 26% more hip replacements since 2019
- 21% more knee replacements
- 11% more cataract surgeries
- 16% more MRI and CT scans
Benchmark performance in 2024:
| Procedure | Within Benchmark |
| Hip Replacement | 68% within 6 months |
| Knee Replacement | 61% within 6 months |
| Cataract Surgery | 69% within 112 days |
Median MRI wait times rose by 15 days from 2019 to 2024. CT waits rose by 3 days. OECD reports 9.1% unmet healthcare need in Canada.
United States – Faster Scheduling For Many, Financial Barriers For Others
The US does not manage access through centralized wait lists for most elective services. Many insured patients receive faster specialist appointments, particularly in well resourced urban markets.

Another type of delay still exists:
- Waiting for deductible thresholds
- Waiting for prior authorizations
- Searching for in-network specialists
- Delaying care due to expected bills
Census data places the uninsured rate at 8.2% in 2024, or about 27.2 million people.
What Patients Actually Pay
Money becomes part of nearly every medical decision once a household starts scheduling visits, filling prescriptions, and reading insurance statements.
Typical Canadian Experience
For insured hospital and physician care, point-of-care billing is uncommon.
Out-of-pocket costs usually show up for:
- Prescription drugs
- Dental and vision services
- Private clinics
- Travel and time costs related to longer waits
Only 50% of Canadians report satisfaction with the availability of quality healthcare, reflecting ongoing pressure in non-hospital care and wait-dependent services.
Typical US Experience
Even insured households often face layered costs:
- Monthly premiums
- Deductibles before coverage begins
- Copays and coinsurance
- Separate prescription tiers
- Out-of-network billing risks
Medical debt remains widespread. National reporting shows millions of households carrying unpaid medical balances tied to price levels and plan rules.
Outcomes And Population Health Signals
Health outcomes reflect more than healthcare policy alone. Income, housing, nutrition, and public safety also matter. Even so, national indicators reveal consistent patterns.

OECD outcome data shows:
| Metric | Canada | United States |
| Life Expectancy | 81.7 years | 78.4 years |
| Preventable Mortality | 126 per 100,000 | 217 per 100,000 |
| Treatable Mortality | 58 per 100,000 | 95 per 100,000 |
The Commonwealth Fund ranks the US last among 10 peer countries for overall health system performance.
Administrative Complexity
Administrative complexity shapes how care moves through each system, influencing paperwork, billing steps, approval delays, and how much time patients and clinics spend on non-medical tasks.

Canada
Single payer claims for hospital and physician services simplify billing for core care. Complexity still exists in drug plans, disability coverage, long-term care, and employer benefits, yet core medical billing remains relatively straightforward.
United States
Multi-payer design creates a heavy administrative infrastructure:
- Billing departments
- Coding specialists
- Prior authorization systems
- Eligibility verification
- Appeals workflows
Patients often face annual plan changes that alter networks and cost-sharing rules.
Side By Side Overview
| Dimension | Canada | United States |
| Coverage Baseline | Universal hospital and physician coverage | Multi-channel coverage with the uninsured population |
| Financing | Mostly tax funded, 70% mandatory prepayment | Premiums, taxes, and out-of-pocket |
| Patient Costs | Low point of care for insured care | Premiums, deductibles, copays common |
| Access Pattern | Wait time pressure for elective care | Faster scheduling for many, cost barriers for others |
| Outcomes | Higher life expectancy, lower avoidable mortality | Lower life expectancy, higher avoidable mortality |
What Sets Them Apart In Practical Terms
- Coverage: Canada guarantees a simpler baseline for core medical services, while the US spreads coverage across many payers with ongoing gaps.
- Affordability: Canada limits point-of-care billing for insured services. US households routinely face layered cost exposure.
- Access: Canada faces wait time pressure for elective care. US access depends on plan design, networks, and personal finances.
- Spending: US spending remains substantially higher per person and as a share of GDP.
- Outcomes: Population health indicators favor Canada on life expectancy and avoidable mortality.
Read Also: Destinations Around The World Americans Choose For Medical Care
Final Thoughts
Neither model feels perfect on the ground. Canada offers financial protection for core medical care but struggles with speed and coverage gaps outside hospitals. The United States offers faster specialty access for many but exposes households to high costs, complex billing, and medical debt.
The distance between the two systems appears not in ideology, but in how everyday care feels. One emphasizes pooled protection and slower throughput. The other emphasizes choice, speed, and price signals that shape access. Families crossing the border feel that difference in appointment calendars, pharmacy counters, and household budgets long before they ever see it in a policy brief.
