Road safety remains a pressing public health and infrastructure issue across Canada and the United States.
Recent years have brought sharper contrasts in outcomes, especially during 2025 and 2026.
Experts and international road safety benchmarks point to widening performance gaps tied to policy choices, street design, and enforcement practices.
Statistics tell us a clear story of two neighboring countries moving in opposite directions, despite shared economic capacity and vehicle technology.
Latest Statistics and 2026 Developments
Recent data shows a widening separation in safety outcomes during 2025 and 2026.
Policy direction, enforcement consistency, and street design choices shaped how each country responded to post-pandemic traffic conditions.
Canada from 2025 to 2026
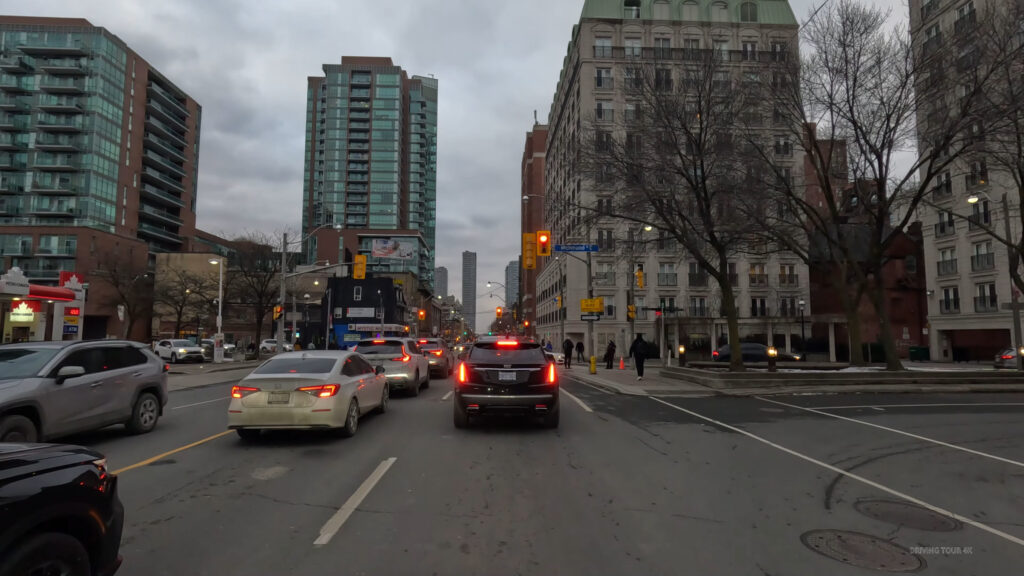
Canada continues to report a strong safety performance by international standards.
A national road fatality rate of about 5 deaths per 100,000 people reflects sustained progress rather than short-term improvement.
Urban investment strategies focus on reducing conflict points and lowering operating speeds, leading to fewer severe collisions.
Coordinated action at the municipal and provincial levels reinforces predictable driver behavior.
Several measurable outcomes illustrate this trend:
- Road fatality rate is holding near 5 per 100,000 people
- Declines in cyclist and pedestrian deaths tied to protected networks
- Lower average vehicle speeds in redesigned urban corridors
Traffic calming tools such as narrowed lanes, raised crossings, and curb extensions shape daily driving patterns.
Automated enforcement reinforces these designs by discouraging speeding and red-light violations.
Safer intersections and connected bike infrastructure reduce exposure for vulnerable road users, contributing to fewer life-altering injuries.
United States from 2025 to 2026
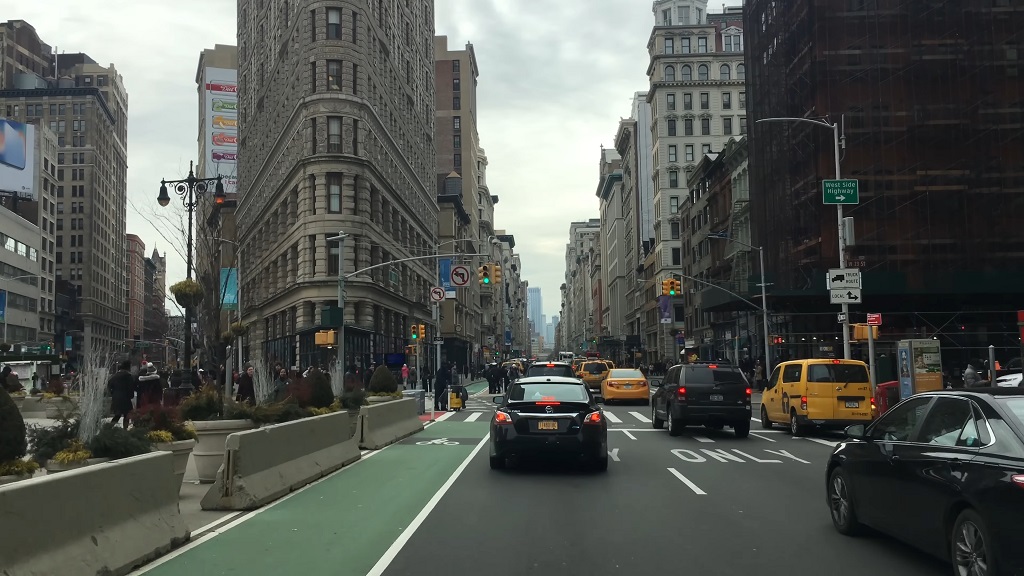
United States safety outcomes remain significantly worse during the same period.
Road fatality rates hover around 12.5 deaths per 100,000 people, placing national performance more than twice as high as Canada.
Traffic volumes rebounded rapidly after pandemic disruptions, yet safety indicators failed to recover. Increased funding at federal level did not translate into consistent local results.
Key indicators underline the challenge:
- Fatality rate near 12.5 per 100,000 people
- Continued growth in pedestrian and cyclist deaths
- Elevated crash severity on urban arterials
High-speed road design persists across metropolitan areas, increasing injury risk when collisions occur.
Limited enforcement capacity and uneven adoption of safety tools allow risky driving behavior to continue.
Urban streets carrying fast-moving traffic place pedestrians and cyclists in constant danger, especially in corridors lacking physical separation.
Key Differences in Policy and Infrastructure
Institutional choices shape safety outcomes over time. Canada and the United States approach regulation, enforcement, and street design with markedly different priorities.
Canada’s Road Safety Model
Vision Zero frameworks operate across many Canadian cities and regions, setting explicit targets for eliminating traffic deaths.
Automated speed enforcement enjoys strong institutional and public support, extending across urban cores and suburban corridors.
Street design standards prioritize safety outcomes rather than maximum vehicle flow.
In the rare cases when drivers face impaired driving charges, access to the best impaired driving legal professionals ensures due process while reinforcing public trust in the justice system.
Core elements of this model include:
- Widespread use of red-light and speed cameras
- Lower default speed limits on local and collector streets
- Shorter pedestrian crossing distances and protected bike lanes
Cities such as Toronto and Vancouver apply complete streets strategies that reduce crash severity through design. Predictable regulation across provinces strengthens compliance and limits confusion for drivers traveling between regions.
United States Road Safety Challenges
Traffic governance in the United States remains fragmented.
Laws vary widely across states, producing inconsistent enforcement and mixed behavioral cues.
Political resistance limits deployment of automated enforcement tools, even in high-injury networks.
Several structural issues shape outcomes:
- State-by-state variation in traffic laws and penalties
- Limited political support for speed cameras
- Continued prioritization of vehicle throughput on major roads
Highways and urban arterials dominate city networks, often cutting through residential and commercial areas.
Accountability mechanisms remain weak, reducing pressure to redesign dangerous corridors.
National safety goals exist, yet implementation gaps persist at the local level.
Public Attitudes and Cultural Factors
Social attitudes influence how safety policies are adopted and enforced. Public perception of risk and responsibility differs notably between the two countries.
Canada
Road safety is broadly treated as a shared public good tied to collective well-being.
Political consensus around regulation and enforcement remains relatively stable, allowing safety programs to persist across election cycles.
Speed management is commonly framed as a life-saving intervention rather than a restriction on personal choice.
Traffic calming measures such as speed cameras, curb extensions, and reduced lane widths generate limited backlash.
Community engagement often centers on safety benefits for children, seniors, and daily commuters.
Predictable policy direction enables municipalities to commit to long-term redesigns without frequent reversals.
United States
Cultural narratives centered on individual freedom frequently clash with public health-oriented traffic controls.
Driving is often perceived as a personal entitlement, creating resistance to measures that regulate speed or behavior.
Safety interventions are more likely to be debated through the lenses of inconvenience, delay, or enforcement fairness.
Policy discussions often prioritize driver convenience over systemic risk reduction. Speed reduction strategies face heightened scrutiny, slowing adoption even when data shows clear safety benefits.
Public skepticism limits enforcement reach and weakens compliance.
Case Studies
Urban comparisons reveal how attitudes and policy choices materialize in everyday conditions. City-level decisions illustrate how similar goals can produce very different results.
Toronto and Los Angeles
Toronto achieved sustained reductions in traffic deaths through coordinated and enforceable measures.
Lower default speed limits align with targeted speed camera deployment and redesigned pedestrian crossings.
Street geometry reinforces safer behavior by limiting opportunities for excessive speed.
Key elements supporting progress include:
- Reduced default speed limits on neighborhood streets
- Speed camera zones placed in high-injury corridors
- Pedestrian crossings designed to shorten exposure time
Los Angeles adopted Vision Zero principles but continues to experience rising traffic deaths.
Enforcement capacity remains limited, and redesign of wide arterial roads advances slowly.
Policy commitments exist, yet physical conditions and driver behavior show minimal change.
Vancouver and Houston
Vancouver invested heavily in protected bike lanes, intersection upgrades, and transit expansion.
Safer street design produced measurable improvements for non-motorized users. Predictable traffic environments support safer travel choices across modes.
Observed outcomes include:
- Declines in injuries involving cyclists and pedestrians
- Increased separation between vehicles and vulnerable users
- Improved intersection visibility and signal timing
Houston continues to face severe pedestrian fatality challenges.
Walking and cycling infrastructure remains sparse, leaving vulnerable users exposed to fast-moving traffic.
Long crossing distances and wide lanes increase both crash frequency and severity.
Closing Thoughts
By 2026, differences between Canada and the United States in road safety reflect structural and cultural choices as much as raw statistics.
Canada’s consistent regulation, data-driven planning, and street design reforms translate into lives saved.
United States outcomes lag despite substantial resources, shaped by political fragmentation, car-centered planning, and weaker enforcement.
Global focus on preventable traffic deaths continues to grow, and a comparison between these two countries offers clear lessons on how policy direction shapes safety results.
