Student loan debt in the United States has reached record levels in 2025, crossing $1.8 trillion in total, with more than 42 million Americans carrying federal student loans.
On average, borrowers owe around $39,000 each, but debt burdens vary widely depending on where you live.
According to the Education Data Initiative (2025), residents of the District of Columbia, Maryland, Georgia, and Virginia face the highest average debt per borrower, while states like California and Texas lead in total outstanding balances because of their large populations.
Student Loan Debt by the Numbers

At the national level, the latest figures show $1.814 trillion in total student loan debt, with roughly 92% coming from federal loans and the rest from private lenders.
The average federal student loan debt per borrower is $39,075, marking a doubling of average balances since 2007.
Borrowers face monthly payments typically between $200 and $299, though this can vary significantly based on repayment plan. Despite repayment programs, delinquency rates are climbing.
States With the Highest Average Student Loan Debt
The District of Columbia stands out, with the highest average student loan debt in the nation, more than $54,500 per borrower. Among states, Maryland ($43,781), Georgia ($42,226), and Virginia ($40,287) have the largest average balances.
These figures are well above the national average of ~$39,000, reflecting a mix of high tuition costs, concentration of professional degrees, and regional economic patterns.
States With the Highest Average Student Loan Debt (2025)
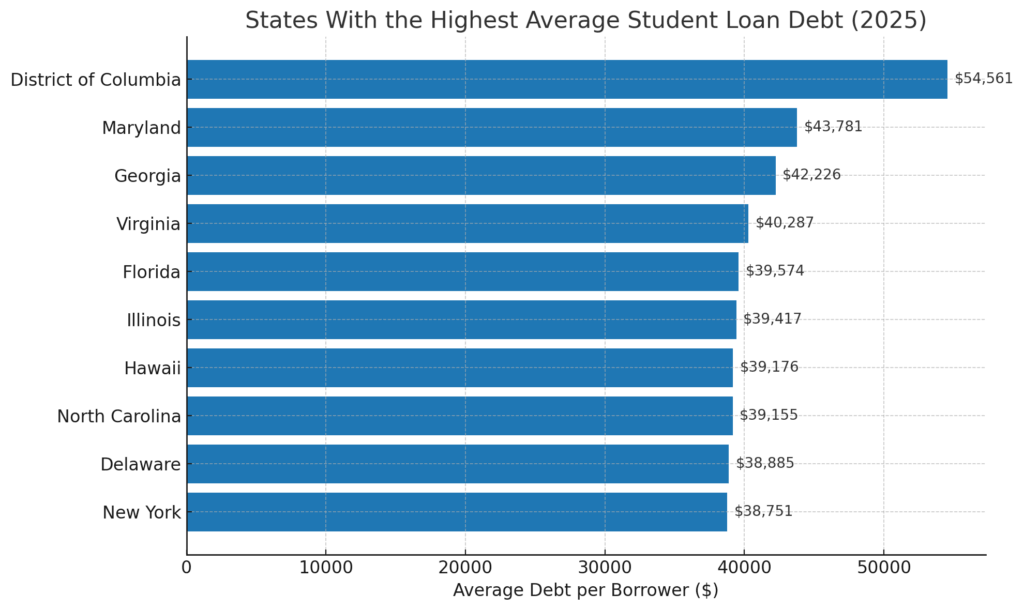
Maryland and Virginia house many government workers with graduate and law degrees, while Georgia and Florida have large numbers of borrowers but relatively low wages compared to their debt loads.
States With the Largest Total Student Loan Balances
When it comes to the sheer size of debt, the picture shifts toward population-heavy states.
California leads the nation with $151.5 billion in outstanding student loans, followed by Texas ($131.9 billion), Florida ($108.1B, and New York ($96.3B).
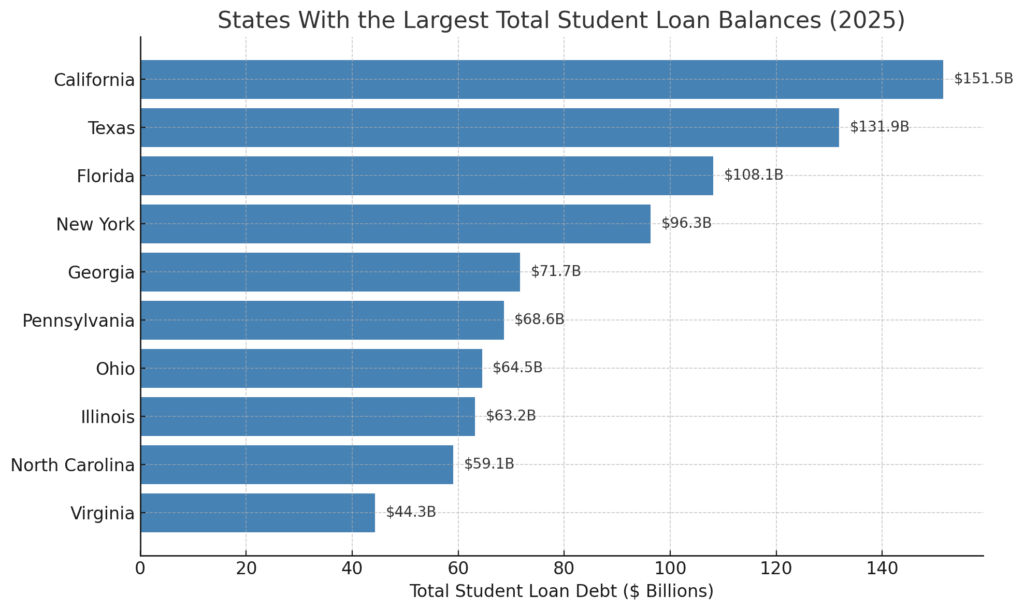
These states combine large populations with high rates of college enrollment. California alone accounts for nearly 8% of all U.S. student debt.
Meanwhile, states like Georgia and Pennsylvania appear in both tables, indicating both high averages and high totals, a double burden for their residents. MarketWatch (2025) reported that over 20% of loans are now more than 90 days late, a record high, with even prime-score borrowers falling behind.
Borrower Demographics and Trends
Student loan debt is not distributed evenly across the U.S. population. The burden varies sharply by age, gender, race, education level, and income bracket, and these differences directly influence repayment outcomes.
According to Pew Research (2024), debt has risen by 42% over the last decade, fueled by rising tuition costs and increased enrollment in graduate programs.
Student Loan Debt by Age Group
Younger borrowers carry debt early in their careers, but older borrowers often face the steepest challenges. Many Americans aged 50 and above are paying both their own loans and Parent PLUS loanout forfor forout their children.
Federal Student Loan Debt by Age (2025)
| Age Group | Share of All Federal Debt | Avg Debt per Borrower | Key Notes |
| Under 25 | 5.6% | $14,434 | Mostly recent graduates; smaller balances but low income |
| 25–34 | 29.4% | $32,801 | Largest share of borrowers entering repayment peak |
| 35–49 | 39.6% | $43,302 | Balances highest; many in repayment + graduate debt |
| 50–61 | 20.2% | $46,556 | Highest average balances; Parent PLUS loans are common |
| 2+ | 5.3% | $39,200 | Some are still holding debt late in life, a growing trend |
Older borrowers often face a greater risk of delinquency, since income may stagnate while balances persist. In fact, defaults among those 50+ doubled between 2010 and 2025, a sign of long-term repayment struggles.
2. Student Loan Debt by Gender
Women carry a disproportionate share of the student loan crisis, holding nearly two-thirds of total debt. This imbalance reflects both higher college enrollment among women and persistent wage gaps that slow repayment.
Federal Student Loan Debt by Gender (2025)
| Gender | Share of Total Debt | Avg Debt per Borrower | Notable Trends |
| Women | ~64% | $39,000+ | Higher enrollment in graduate/professional programs; slower repayment due to wage gaps |
| Men | ~36% | $37,000+ | Lower balances on average, but higher default rates among non-completers |
Among women, Black women face the steepest challenges, with balances growing on average 13% in the first 12 years after graduation, compared to 7% for white women.
3. Student Loan Debt by Race and Ethnicity
Race and ethnicity play a major role in debt burdens, tied to disparities in family wealth, graduation rates, and access to high-earning jobs.
Average Student Loan Debt by Race/Ethnicity (Bachelor’s Graduates)
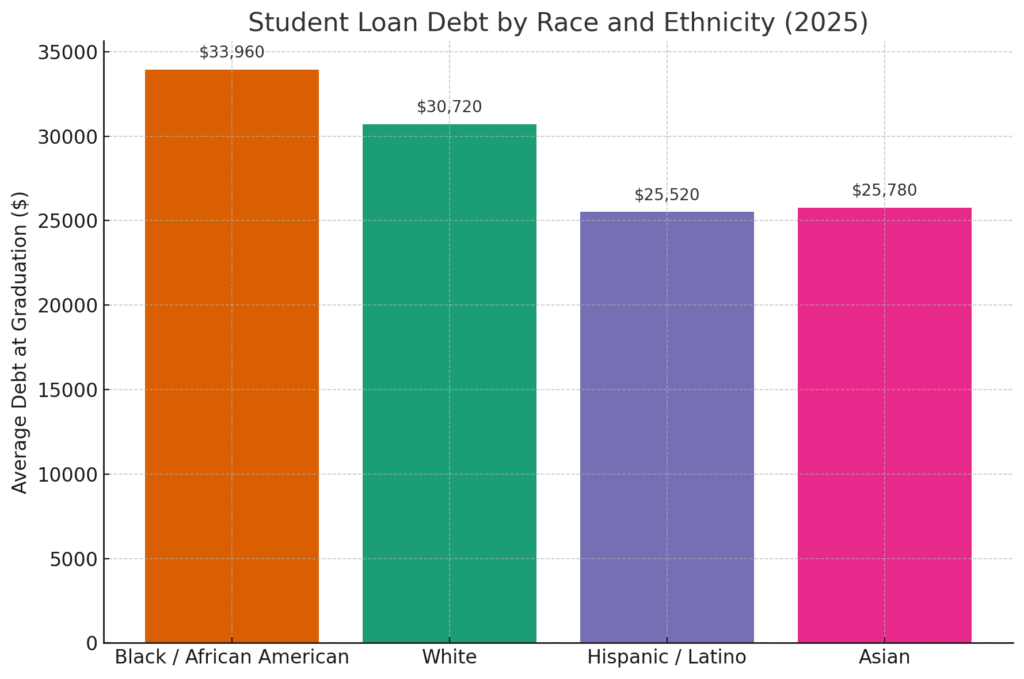
By 20 years after entering repayment, the typical Black borrower still owes 95% of their balance, while white borrowers owe 6% less than the original (Brookings, 2024).
4. Student Loan Debt by Education Level
Debt levels rise significantly with higher degrees. While bachelor’s degree holders typically carry around $29,000–$33,000, graduate borrowers, especially those in law, medical, and professional programs, often owe $70,000–$200,000+.
Average Student Loan Debt by Education Level (2025)
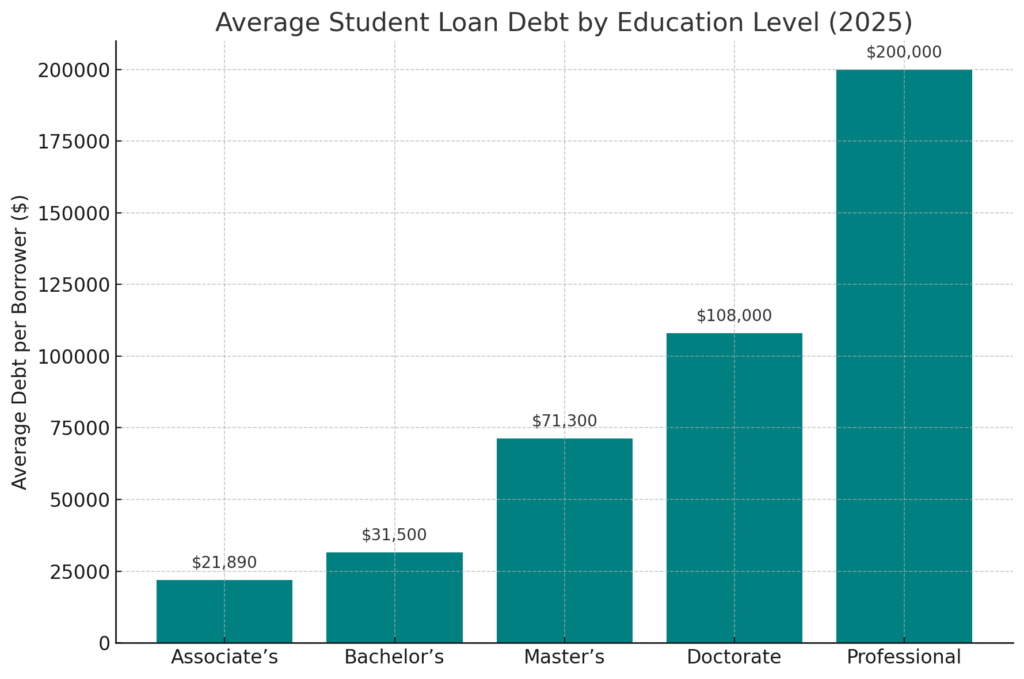
While graduate borrowers earn more, they also experience longer repayment horizons, often 20+ years.
5. Student Loan Debt by Income Level
Income strongly predicts repayment success. Borrowers in the lowest income brackets are far more likely to fall behind, even with smaller balances, according to NASFAA.
Borrower Income vs. Loan Outcomes (2025)
| Income Bracket | Avg Loan Balance | % Delinquent / Default | Notes |
| <$25,000 | $24,000 | 32% | Most vulnerable group; many in default |
| $25,000–49,999 | $32,000 | 24% | Moderate debt but unstable repayment |
| $50,000–74,999 | $38,000 | 15% | Better repayment rates; still pressured |
| $75,000–99,999 | $41,000 | 8% | Manageable with steady payments |
| $100,000+ | $55,000+ | 4% | Largest balances but lowest delinquency |
This gap shows why income-driven repayment plans (IDR) have become essential, but even these often leave balances growing instead of shrinking.
6. Student Loan Repayment Status
View this post on Instagram
Repayment outcomes show the real stress borrowers face. As of 2025, fewer than 40% of borrowers are current on their loans.
Student Loan Repayment Status (2025)
| Status | Share of Borrowers | Notes |
| Current on Payments | 38% | Less than half are up to date |
| 31–90 Days Late | 12% | Early delinquency, high risk of slipping behind |
| 91–180 Days Late | 10% | Serious delinquency |
| 181–270 Days Late | ~10% (4.1M borrowers) | On path to default ([Investopedia, 2025]) |
| Default (271+ days) | 12% | Defaults rising; credit damage severe |
| In Forbearance / Deferment | 8% | Temporary relief, interest accrues |
| On IDR Plans | ~25% | Payments linked to income, balances often grow |
These repayment struggles highlight why student debt has become one of the defining financial issues of the decade.
Methodology
This article was crafted using the most recent 2024–2025 datasets from reputable sources, including the Education Data Initiative, Pew Research, Brookings, Investopedia, MarketWatch, and the Financial Times.
We reviewed federal and private loan statistics, demographic breakdowns, and repayment outcomes to ensure accuracy and breadth. State-level data was compared both by average borrower debt and total outstanding balances to highlight regional disparities.
Demographic insights were organized into age, gender, race, education, and income categories for clarity. All numbers were cross-checked against multiple sources to provide a reliable and comprehensive picture of the student loan landscape.
Key Takeaway
Looking at demographics shows just how uneven the student debt crisis is. Older borrowers and Black women face the steepest balances, while low-income borrowers are most at risk of default.
Graduate and professional degrees inflate balances dramatically, but even bachelor’s holders struggle when wages lag.
Growth in the fastest-growing job sectors in the US offers some relief, but many roles still require advanced training that adds to debt burdens.
Delinquencies now affect nearly one in four borrowers, reshaping financial futures across entire age groups and communities.