According to the latest insights, the average number of people that die every day in the United States is around 8,460.
That number comes from annual stats. It’s an estimate, since tracking the exact number day by day would take a ton of effort and resources.
What we do know more clearly are the main causes behind those deaths.
Heart disease is the biggest one. Not just in the U.S., but around the world. After that, it’s cancer, accidents, and long-term health conditions.
In the following sections, we will provide more insights about how many people die a day, along with causes, trends, and other data.
| How many people die a day(on average) | 8,460 |
| The number of people who die every year | 3,090,582 |
| Leading Causes of Death | Heart Disease |
| Number of people dying per hour | 348 |
| Total U.S. Population | 345,427,000 |
| Life Expectancy in the US | 79.25 years |
| Main Cause Apart from Health/Natural | Accidents/Overdose |
Number of People That Die Each Day in the US

As we already mentioned, following the exact figure of how many people die every day would be very difficult.
Still, we have the data available at World Population Review. They are tracking the demographic changes in the US and on a global level.
According to this platform, the average number of people who die every day is 8,460.
When we go even deeper into calculations, we get the number of 348 people dying every hour.
The latest available information we found that confirms the number of people who died in a year is shared by KFF. According to their research, there were 3,090,964 deaths in 2023.
We still don’t have full, valid data for 2025, and we won’t deal with speculations. So, you will have to wait until next year. However, there are no indications that the difference will be drastic compared to 2024.
What Are the Leading Causes of Death In the US?
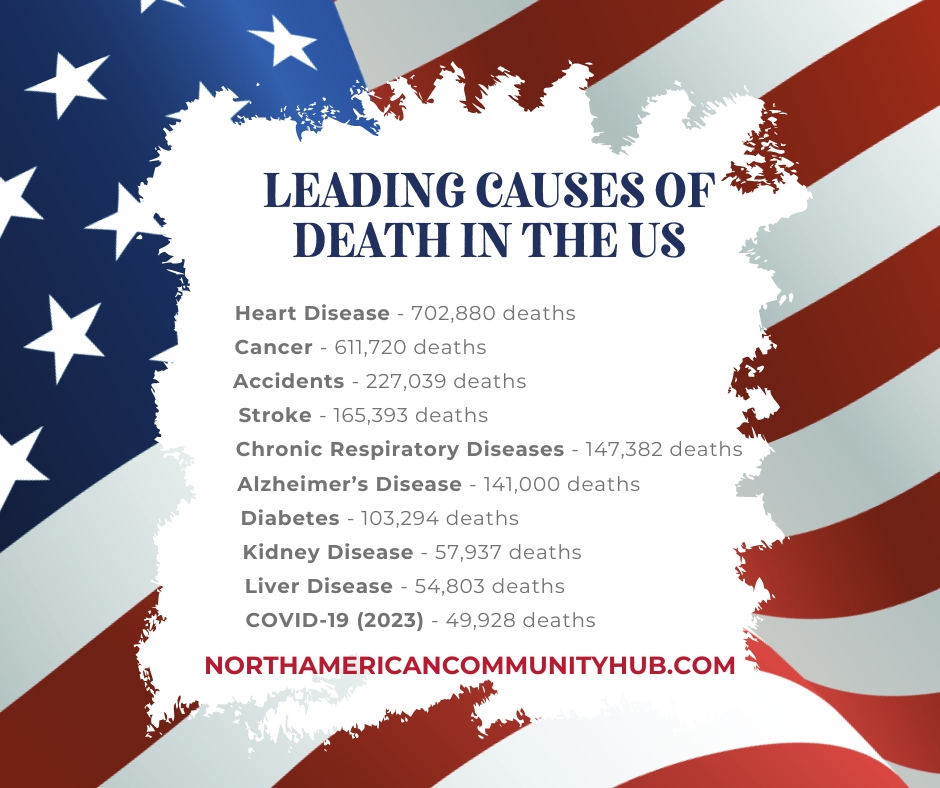
| Cause of Death | Annual Deaths |
|---|---|
| Heart Disease | 702,880 |
| Cancer | 611,720 |
| Accidents (Unintentional Injuries) | 227,039 |
| Stroke | 165,393 |
| Chronic Respiratory Diseases | 147,382 |
| Diabetes | 103,294 |
| Kidney Disease | 57,937 |
| Liver Disease and Cirrhosis | 54,803 |
1. Heart Disease
Heart disease is the main cause of death in the U.S. It took 702,880 lives in 2022. That’s one out of every five.
The death rate stood at 210.9 per 100,000 people that year.
Coronary heart disease, which is the most common cause, took 371,506 lives.
The financial impact was enormous, with total direct and indirect expenses adding up to nearly $252.2 billion between 2019 and 2020.
2. Cancer
While cancer deaths in the U.S. have decreased in recent years, experts say one group has seen an overall rise in cancer rates: younger Americans.https://t.co/gpcPF5K6ep
— PBS News (@NewsHour) September 2, 2024
Cancer is another leading cause of death, with 611,720 lives lost in 2024, which translates to 1,676 people each day.
Medical progress has improved treatment and early detection, yet the national cancer mortality rate still stands at 146.0 per 100,000 people annually.
Maybe the latest innovations in this field could help us resolve the problem with one of the most challenging diseases.
3. Accidents and Injuries

Accidents, car crashes, falls, and other tragedies took 227,039 lives in 2022, ranking as the third leading cause of death.
Out of those, motor vehicle crashes were responsible for 44,534 fatalities.
4. Stroke (Cerebrovascular Diseases)
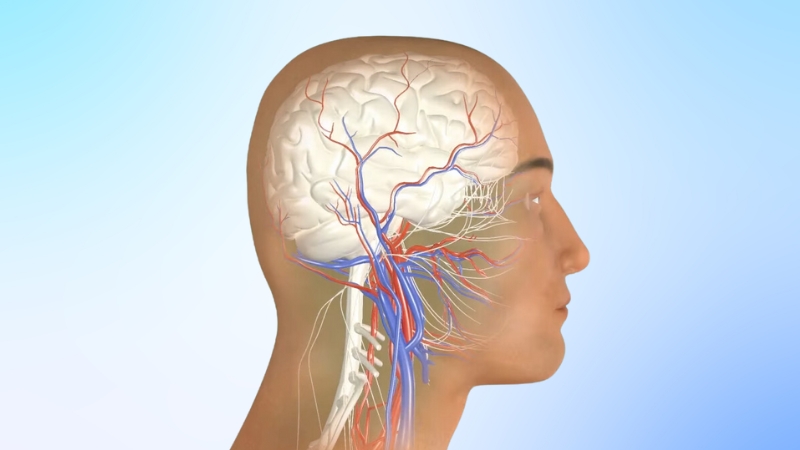
In 2022, strokes took 165,393 lives.
Heart Newsroom highlights that 453 people die from strokes every single day.
A significant number of these deaths could be avoided with better control of high blood pressure and other risk factors.
5. Chronic Respiratory Diseases
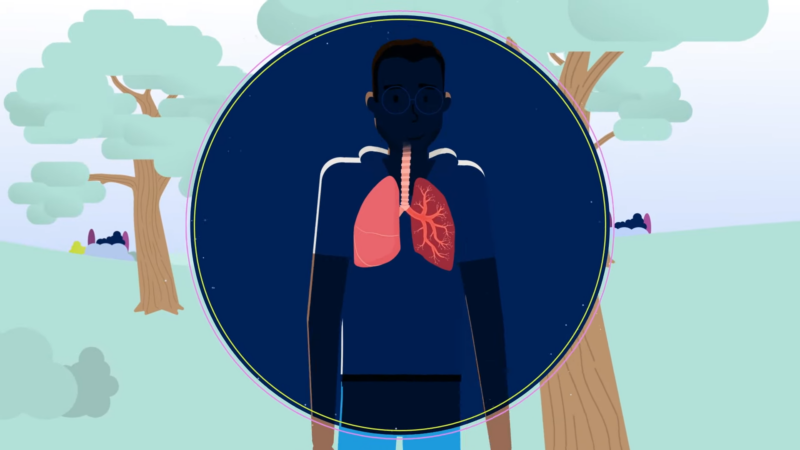
Long-term lung diseases like Chronic Obstructive Pulmonary Disease (COPD) take a serious toll on public health across the United States.
The last detailed report about how many people died of respiratory diseases is from 2022. The number is 147,382.
Around 11.7 million people in the United States live with COPD, driving up healthcare expenses every year, as reported by the American Lung Association.
6. Diabetes

Diabetes takes too many lives every year, and the toll keeps rising.
In 2021, it was the main cause of death on 103,294 certificates. Those numbers are putting it in the eighth position among leading causes in the United States.
Sadly, those numbers represent much more than statistics, as they involve parents, friends, and neighbors who never had the chance to get the help or knowledge they needed.
We can also notice the critical situation related to the number of people with diabetes in the United States. Around 38.4 million Americans have it, which is about 11.6 percent of the population.
The number keeps climbing, but the bigger issue is not only the disease itself. The real problem lies in how little support people receive when it comes to food control, awareness, and proper education.
Learning what goes into daily meals can change everything. Balanced diets, portion awareness, and a simple understanding of sugar impact can help millions avoid the worst outcomes.
Knowledge about prevention is what truly saves lives.
7. Kidney Disease

Kidney disease is the ninth leading cause of death.
The report we got from the National Institutes of Health shows that nearly 90% of people with CKD don’t recognize the symptoms on time, before any serious consequences.
People with diabetes are the most common patients, with around 30% of them facing this issue.
8. Liver Disease and Cirrhosis
Liver disease and cirrhosis remain serious health threats. The main causes are alcohol intake and hepatitis infections.
In 2022, they were responsible for 54,803 deaths, which puts liver issues in position 10 among the deadliest diseases in the US.
Drug Abuse As a Cause of Death
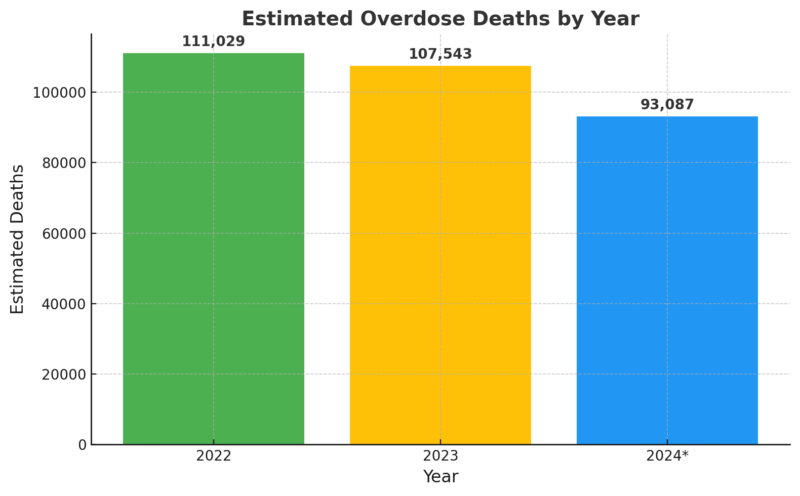
*Note: The figure is based on provisional data for the 12 months ending June 2024.
Drug overdose deaths reached around 107,543 in 2023, showing us a 3% drop from the 111,029 recorded the previous year. Overdose deaths dropped by 14.5% in the 12 months leading up to June 2024.
Life Expectancy
The average life expectancy in the United States is 79.25 years. There is a modest (0.18%) increase from 79.11 years in 2023.
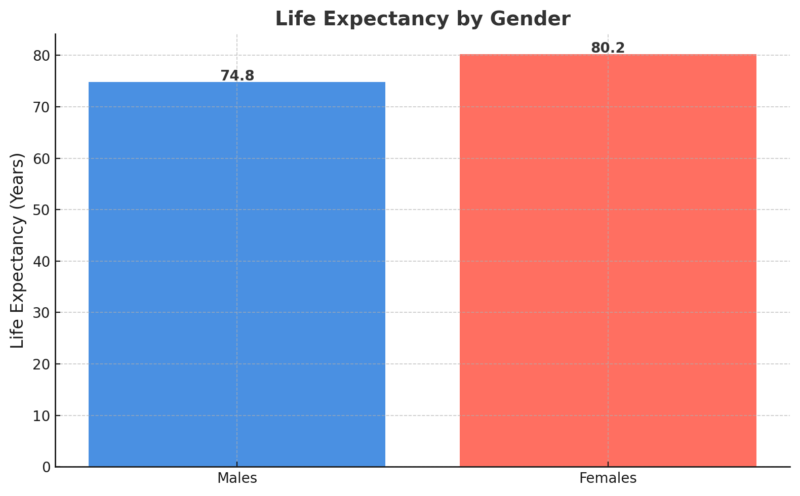
When it comes to differences between genders, data from the CDC show that females live over 5 years longer than males on average.
Back in 2019, before the world turned upside down, life expectancy in the U.S. stood at 78.8 years.
Then came COVID-19, and that number took a hit, dropping to 76.4 years by 2021.
Now, it has climbed back up to 79.25 years, even surpassing pre-pandemic levels.
Some people find that encouraging. But, compared to many other developed countries, the U.S. is still trailing behind.
Countries like Japan and Switzerland have average life expectancies of over 83 years, which is a significant advantage compared to the US.
FAQs
How many people die from flu and pneumonia every year in the United States?
Around 55,000 people die each year due to flu and pneumonia combined. The elderly population is the most affected group, especially those with chronic health conditions. The CDC records show that annual deaths fluctuate based on the severity of the flu season and vaccination coverage.
How many deaths occur each year due to Alzheimer’s disease?
Alzheimer’s disease causes about 120,000 deaths per year in the United States. It ranks among the top ten leading causes of death nationwide. The number continues to rise as the population ages and life expectancy increases.
How many people die due to suicide every year in the United States?
More than 50,000 people take their own lives each year. Suicide rates have increased in almost every age group, particularly among middle-aged men. Access to mental health services and early intervention remain the most effective methods of prevention.
How many deaths are related to firearms each year?
About 48,000 people die each year in the United States because of firearms. That includes suicides, murders, and accidental shootings.
The Bottom Line
As you can see, thousands of people die every day in the US due to various causes.
More people die during winter, when infections spread faster and weaker immune systems struggle to cope.
At the same time, new health efforts are showing results. Overdose deaths have started to fall, proving that prevention programs and access to treatment can save lives.
Life expectancy has reached 79.25 years and keeps moving up, but health still stands as one of the main challenges.