Minnesota is one of the largest states by land and sits near the middle in population size. In 2025, about 5.76 million people live in the state, according to World Population Review.
The population has been climbing steadily in recent years. Between 2021 and 2022 alone, more than 59,000 new residents were added, thanks to both migration and natural growth.
The state has become a welcoming spot for people moving in from other parts of the country as well as from abroad.
Looking ahead, a major change will be the growing number of residents aged 65 and older, which will influence community needs and public services.
Key Takeaways
- The population of Minnesota is 5.76 million in 2025, growing steadily, largely driven by net migration and natural changes.
- Significant growth is expected in the 65+ age group, with a natural decline projected by the late 2040s, relying on migration for growth.
- Violent crime decreased by 6.9% in 2023, with notable reductions in carjackings (down 37.8%).
- The unemployment rate increased to 3.3% by August 2024.
- Average home value rose to $336,954, with median rents at $1,291.
- 94.7% of Minnesotans are insured, but significant gaps for the American Indian and Hispanic populations.
Total Population and Growth

From 2010 to 2022, the state grew by an average of 0.6% annually. The largest increase during this period occurred between 2019 and 2020, with a 1.2% rise. Factors contributing to this growth include both natural changes (births minus deaths) and migration patterns.
In 2022, the most populous counties, such as Hennepin and Ramsey, remained significant in numbers. The growth rate has not been uniform across all areas, with urban sectors like Minneapolis drawing larger populations compared to rural counterparts. Understanding these variations is crucial for resource planning and policy formulation.
Projected Growth Rates
Looking toward the future, the population is expected to continue growing, but at a slower rate. By 2075, the population will increase from 5.76 million in 2025 to 6.11 million as per Brainerd Dispatch.
Net migration is forecasted to be crucial in supporting this growth as natural change turns negative by 2065, meaning deaths will surpass births.
Demographic Breakdown
Age
| Metric | Value |
|---|---|
| Age | 39 |
| Median Age | About the same as the U.S.: 39 |
| Age Group 70-79 | 8%, similar to U.S. rate of 8% |
The median age of the population is 39, which is consistent with the national median age in the United States. The proportion of individuals aged 70-79 is also similar to the national rate at 8% according to a census reporter.
Population by Age Range
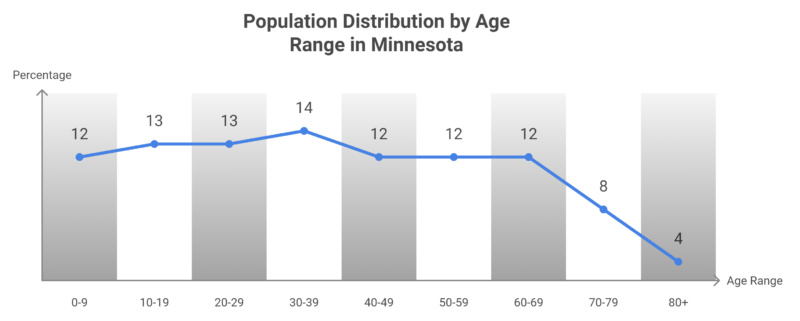
The population is distributed across age groups with relatively balanced percentages, except for a smaller proportion in the 80+ age category. Age ranges 30-39 represent the largest share at 14%, while the oldest group, 80+, makes up just 4% of the population.
Population by Age Category
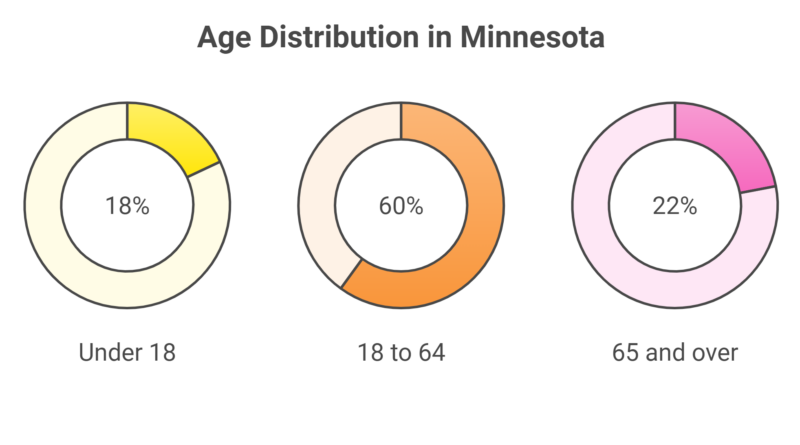
The majority of the population (60%) falls into the working-age group of 18 to 64 years old. Children (under 18) make up 18%, while seniors aged 65 and over account for 22%.
Sex Distribution
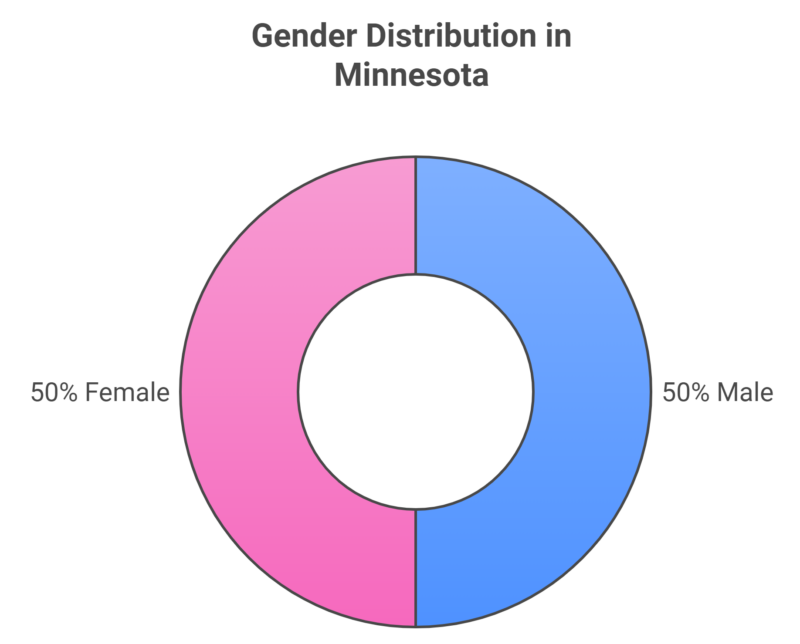
The population is evenly split by gender, with both males and females each comprising 50% of the total population.
Race & Ethnicity
| Race & Ethnicity | Percentage |
|---|---|
| White | 76% |
| Black | 7% |
| Native | 1% |
| Asian | 5% |
| Islander | 0% |
| Other | 1% |
| Two or More Races | 5% |
| Hispanic | 6% |
The majority of the population is White (76%), with smaller percentages for Black (7%), Asian (5%), and Hispanic (6%). Other racial groups, including Native, Islander, and those identifying as more than one race, make up a smaller share of the total population.
Note that “Hispanic” includes respondents of any race, whereas other categories represent non-Hispanic individuals.
Crime Report Overview
| Type of Crime | 2023 Data | Change from 2022 (%) |
|---|---|---|
| Violent Crime (Statewide) | Decreased | -6.9% |
| Violent Crime (Twin Cities Metro Area) | Decreased | -8.2% |
| Violent Crime (Greater Minnesota) | Decreased | -3.4% |
| Murders | 181 (69.6% involving firearms) | Almost unchanged (-1 case) |
| Aggravated Assaults | 9,986 | -3.4% |
| Rapes | 2,053 (72.6% occurred in homes) | -11.85% |
| Motor Vehicle Thefts | 15,612 | -6.8% |
| Carjackings | 372 | -37.8% |
| Larceny Incidents | 72,701 (Lowest in 55 years) | Not specified |
| Bias Crimes | 180 incidents | Increased |
| Use-of-Force Incidents (Firearm Discharge) | 16 | -2 incidents |
| Assaults on Peace Officers | 961 | +0.9% |
- KTTC news report that In 2023, Minnesota saw a significant 6.9% drop in violent crime. In the Twin Cities Metro Area, violent crime decreased more sharply by 8.2%, while greater Minnesota saw a 3.4% decrease.
- The number of murders remained nearly constant, with 181 murders compared to 182 in 2022, and 69.6% involved firearms. Aggravated assaults also fell by 3.4%, while rapes saw a notable decline of 11.85%, most often occurring in homes.
- Motor vehicle theft decreased by 6.8%, with 15,612 vehicles stolen. Carjackings saw a larger drop of 37.8%, from 598 incidents in 2022 to 372 in 2023.
- Larceny incidents reached their lowest in 55 years at 72,7
Geographical Population Distribution

The population distribution in Minnesota varies significantly between urban and rural areas, with urban centers experiencing higher concentrations.
County-level analysis reveals Hennepin and Ramsey as the most populated, reflecting dense settlement patterns.
Households and Families
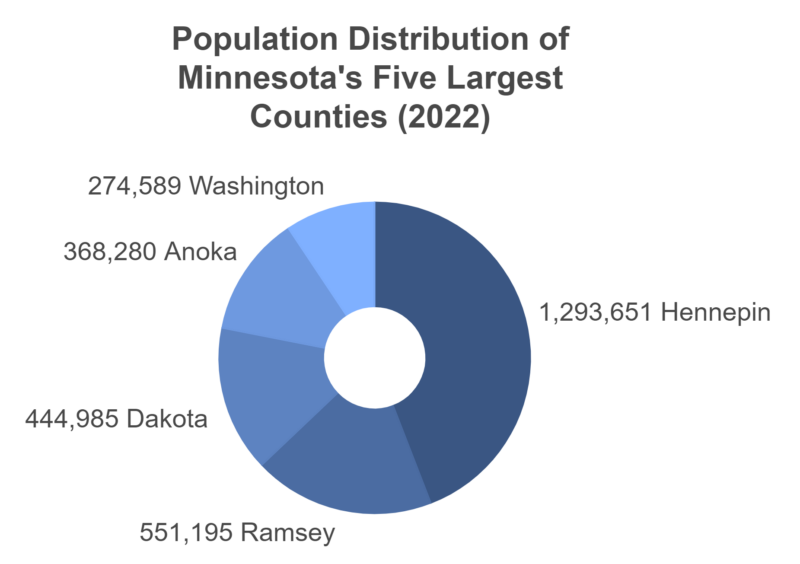
The largest county by population in 2022 was Hennepin County, with over 1.29 million residents.
Ramsey and Dakota counties were the second and third largest, with populations exceeding 550,000 and 440,000, respectively.
Anoka and Washington counties complete the top five, as we can see in the insights provided by the mn.gov.
Fastest Growing Counties by Population (2021-2022)
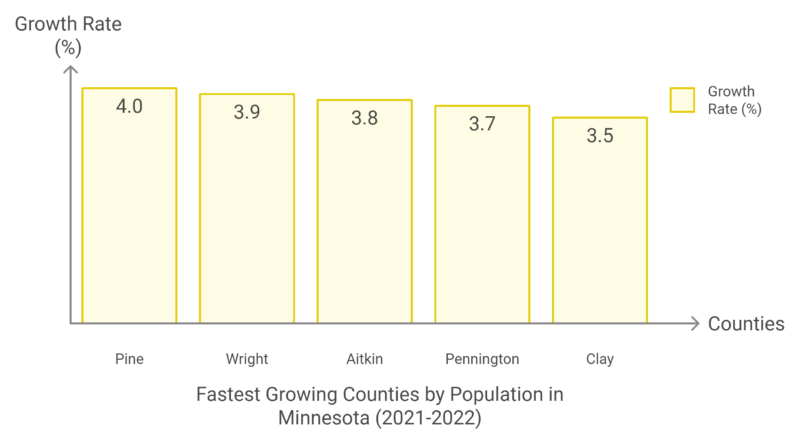
Pine County had the highest population growth rate between 2021 and 2022, growing by 4.0%.
Other fast-growing counties include Wright, Aitkin, Pennington, and Clay, with growth rates ranging from 3.5% to 3.9%.
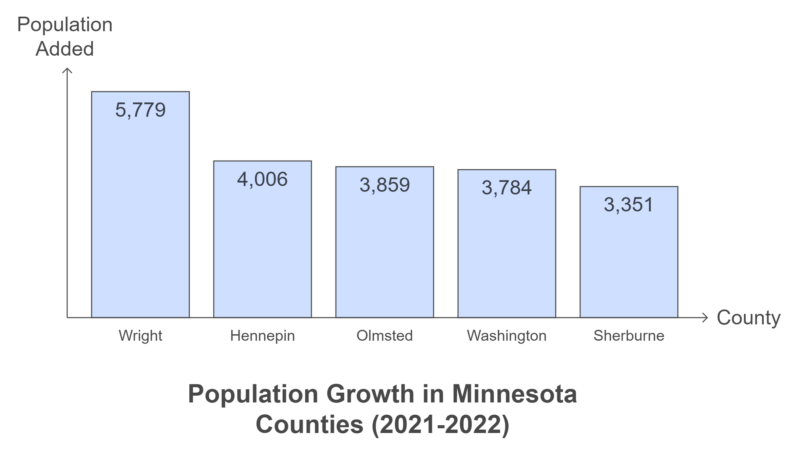
Counties with the Most Residents Added (2021-2022)
Five Largest Cities in Minnesota by Population in 2022
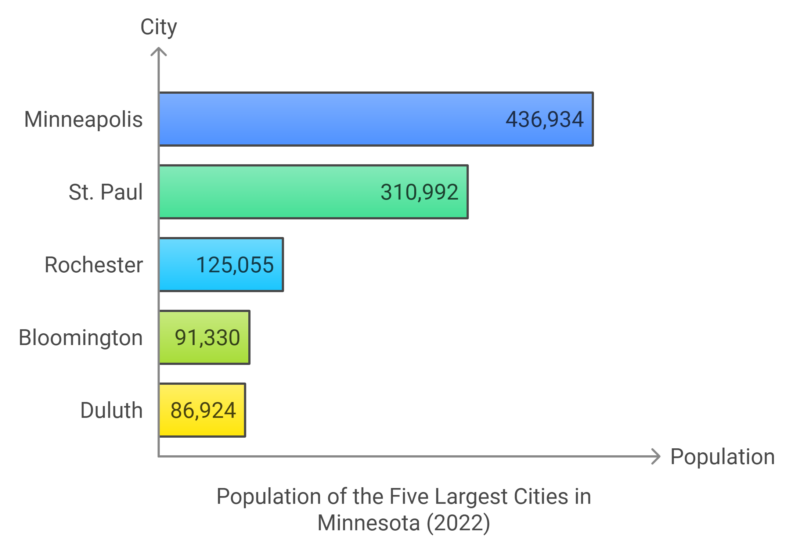
In 2022, Minneapolis remained the largest city in Minnesota, with a population of 436,934. St. Paul, the state capital, had 310,992 residents, while Rochester ranked third with 125,055. Bloomington and Duluth rounded out the top five, with populations of 91,330 and 86,924, respectively.
Family dynamics in Minnesota illustrate a blend of traditional and modern arrangements. Social, economic, and cultural factors influence these structures, affecting interactions and responsibilities within the household.
As observed in recent statistics, demographic changes impact family forms, including single-parent families and extended households.
There has been a shift towards diverse familial setups, influenced by rising mobility, changing marital trends, and evolving career paths. Economic factors such as housing costs and employment opportunities also play roles.
The state’s demographic center continues to monitor these dynamics to ensure that services and policies align with the needs of all family types, focusing on inclusivity and support for different household units.
Educational Attainment
Educational attainment in Minnesota highlights varying levels achieved across different demographic groups. This includes detailed statistics on the levels of education completed by the population and significant data concerning educational institutions within the state.
Levels of Education Completed
In Minnesota, the educational attainment rate for individuals aged 25 to 44 is 63%. This includes 6.7% certificate holders and 56.5% with associate or higher degrees. Disparities exist among different ethnic groups.
For example, high school completion rates among American Indian Minnesotans stand at 28.8%, while Hispanic and Black Minnesotans have rates of 35.5% and 40.5%, respectively. In contrast, nationwide data from 2012 to 2022 indicates an overall increase in high school completion across all racial groups.
For the Black population, high school completion rose from 85% to 90.1%, and for the Hispanic population, it climbed from 65% to 75.2%. These statistics underscore the need for targeted educational support within underrepresented communities.
Educational Institutions Statistics
.@MnDeptEd staff joined @ISD15 High School in celebrating its first cohort of Bilingual Seals awardees. Congratulations to the students for their work to maintain, sustain and further develop their language skills. Learn more about Bilingual Seals at https://t.co/yEYARjuOjs pic.twitter.com/eFmhbh4bzl
— Minnesota Department of Education (@MnDeptEd) October 1, 2024
Minnesota boasts various educational institutions contributing to its high attainment rates. The role of these institutions is pivotal in enhancing access to higher education. Many initiatives focus on increasing graduation rates and ensuring diverse educational offerings.
The Minnesota Office of Higher Education collaborates with the state demographic center to generate reports and baselines essential for future planning. These collaborative efforts aim to create strategic planning pathways to address gaps in educational access and availability.
Emphasis is placed on increasing participation in post-secondary education, particularly for minority groups, to foster a more equitable education landscape. As educational attainment continues to evolve, these statistics provide an essential foundation for understanding educational progression in the state.
Economic Status

Minnesota’s economy reflects a diverse landscape shaped by employment, income levels, and poverty rates. The state’s economic health is evident in its relatively stable employment rates and rising income statistics, though challenges such as poverty remain.
Employment Rates – Labor Force Data (March-August 2024)
According to the U.S. Bureau of Labor Statistics, employment remains steady with some fluctuations due to economic conditions. While the demand for skilled workers continues, the aging population is beginning to impact workforce availability, posing challenges.
Increased investment in job training and education is crucial to maintaining this momentum and addressing gaps.
Civilian Labor Force
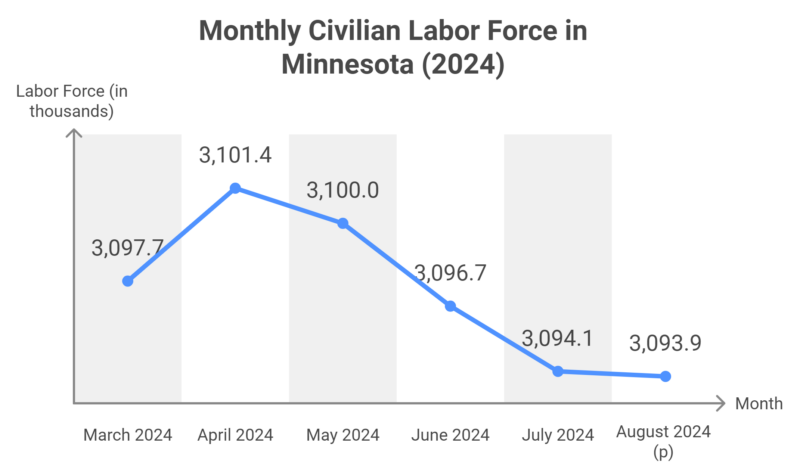
The civilian labor force in Minnesota slightly decreased from March 2024 to August 2024, with minor month-to-month changes.
Employment
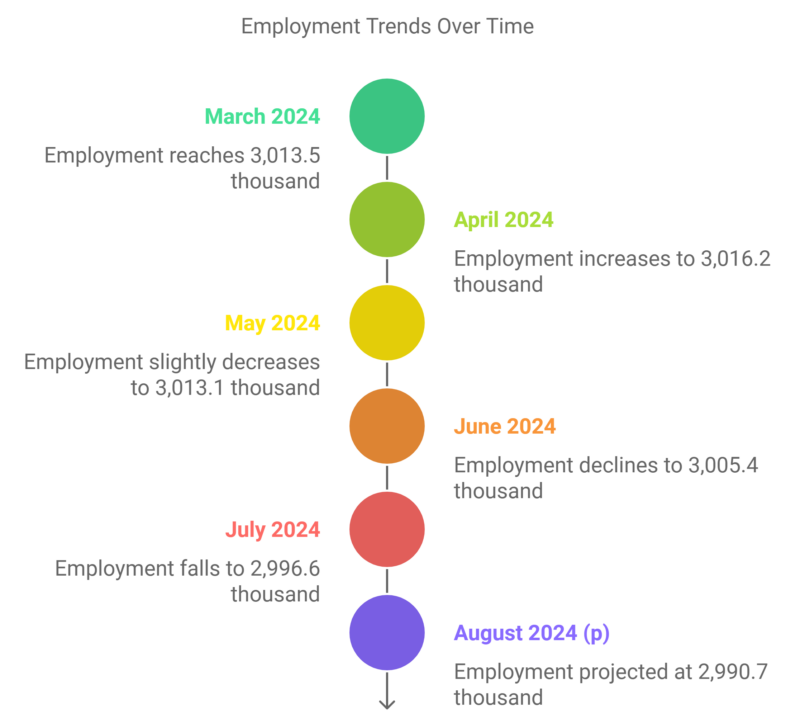
Employment has experienced a declining trend from March to August 2024, with a net loss of about 23,000 employed individuals.
Unemployment
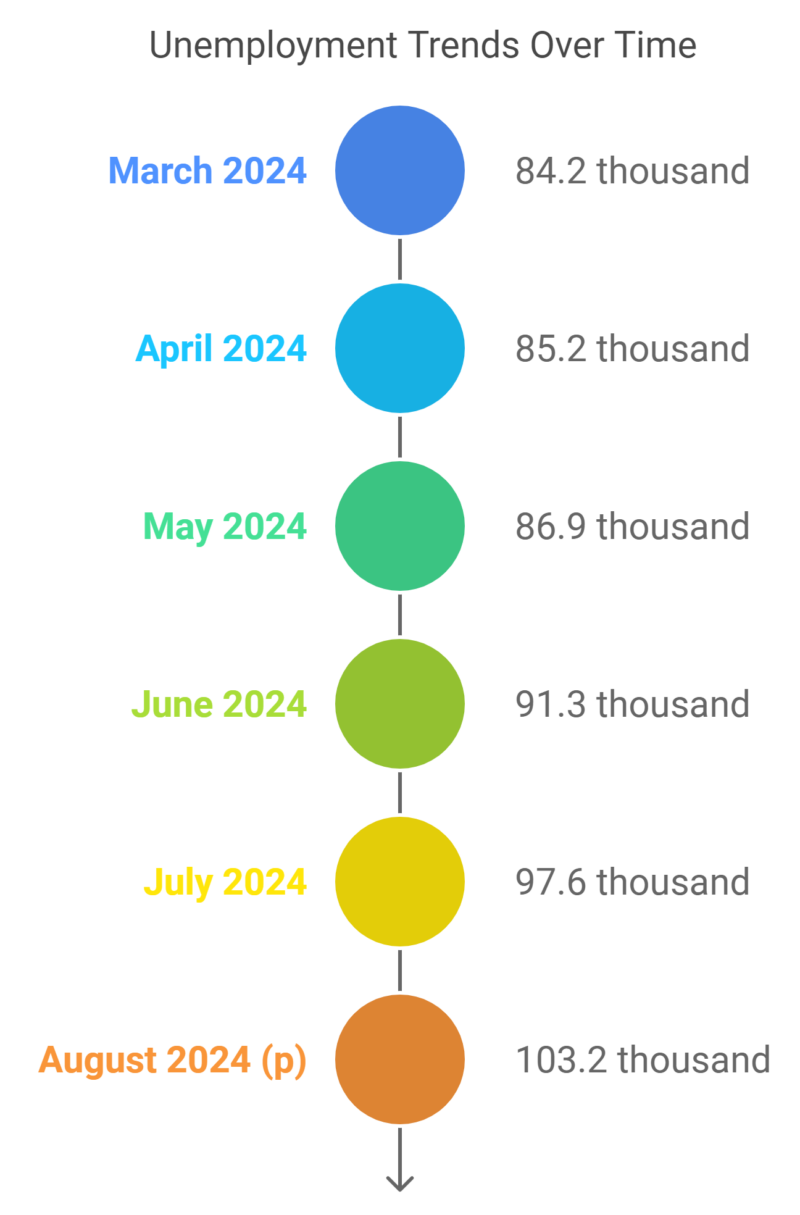
The unemployment count increased steadily from March to August 2024, reaching over 103,000 in August.
Unemployment Rate
| Month | Rate (%) |
|---|---|
| March 2024 | 2.7 |
| April 2024 | 2.7 |
| May 2024 | 2.8 |
| June 2024 | 2.9 |
| July 2024 | 3.2 |
| August 2024 (p) | 3.3 |
The unemployment rate increased from 2.7% in March to 3.3% in August, indicating a gradual rise in the number of people unable to find work.
Nonfarm Wage and Salary Employment (March-August 2024)
Total Nonfarm Employment
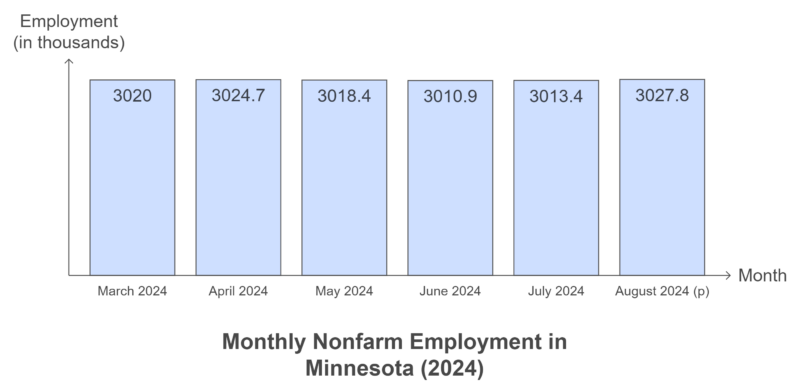
Total nonfarm employment remained fairly stable with minor fluctuations, showing a slight increase in August 2024 compared to earlier in the year.
12-Month Percentage Change (Total Nonfarm)
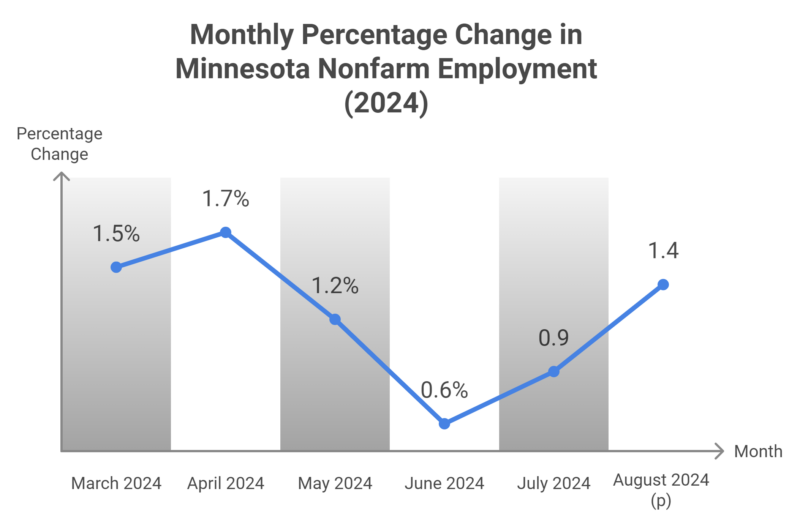
The 12-month change in total nonfarm employment varied throughout the year, reaching 1.4% in August.
Industry-Specific Data (March-August 2024)
Mining and Logging
| Month | Employment (in thousands) | % Change (12-month) |
|---|---|---|
| March 2024 | 6.7 | 9.8 |
| April 2024 | 6.6 | 1.5 |
| May 2024 | 6.5 | 0.0 |
| June 2024 | 6.6 | 0.0 |
| July 2024 | 6.5 | 0.0 |
| August 2024 (p) | 6.4 | -3.0 |
Employment in mining and logging decreased slightly from March to August, with a negative year-over-year change by August.
Construction
| Month | Employment (in thousands) | % Change (12-month) |
|---|---|---|
| March 2024 | 133.9 | -0.2 |
| April 2024 | 135.2 | 1.0 |
| May 2024 | 135.3 | -0.5 |
| June 2024 | 135.6 | -0.9 |
| July 2024 | 134.7 | -1.1 |
| August 2024 (p) | 133.8 | -1.5 |
The construction sector experienced fluctuating employment, with a slight decrease by August and a steady decline in year-over-year growth.
Manufacturing
| Month | Employment (in thousands) | % Change (12-month) |
|---|---|---|
| March 2024 | 324.2 | -0.8 |
| April 2024 | 325.3 | -0.4 |
| May 2024 | 320.8 | -1.6 |
| June 2024 | 319.2 | -2.3 |
| July 2024 | 318.9 | -2.0 |
| August 2024 (p) | 318.2 | -2.3 |
Manufacturing employment showed a general decline from March through August, with the 12-month growth rate consistently negative.
Trade, Transportation, and Utilities
| Month | Employment (in thousands) | % Change (12-month) |
|---|---|---|
| March 2024 | 536.2 | 0.9 |
| April 2024 | 536.0 | 0.9 |
| May 2024 | 534.0 | 0.5 |
| June 2024 | 532.9 | 0.1 |
| July 2024 | 532.6 | 0.2 |
| August 2024 (p) | 533.6 | 0.4 |
Employment in trade, transportation, and utilities remained relatively stable, with a slight improvement in the year-over-year change by August.
Information Sector
| Month | Employment (in thousands) | % Change (12-month) |
|---|---|---|
| March 2024 | 42.7 | -5.3 |
| April 2024 | 42.3 | -6.0 |
| May 2024 | 42.5 | -4.7 |
| June 2024 | 42.3 | -5.2 |
| July 2024 | 41.6 | -5.9 |
| August 2024 (p) | 42.0 | -4.1 |
The information sector has seen declining employment figures with persistent negative 12-month changes, though there was a slight improvement by August.
Other Major Sectors

- Financial Activities: Employment fluctuated slightly, with a consistent negative year-over-year change.
- Professional & Business Services: Notable decline in employment across the months, with significant negative year-over-year changes.
- Education & Health Services: Experienced continuous growth, both in absolute employment numbers and year-over-year change, reaching a 6.6% increase in August.
- Leisure & Hospitality: Employment saw a minor rise, with year-over-year changes generally positive, especially in August (2.4%).
- Other Services: Showed small increases in employment, with a steady 12-month improvement.
- Government: Employment remained steady with positive 12-month growth, peaking at 5.1% in August.
Income Statistics
Income levels in Minnesota have shown an upward trend in recent years, influenced by diverse economic drivers and industries. The median household income has exceeded national averages, highlighting the state’s economic vitality.
Reports from Minnesota’s State Demographic Center indicate increases in household incomes, notably among different cultural groups.
Median Household Income in Minnesota (in Current Dollars)
Source: Trading Economics (United States Federal Reserve’s Data)
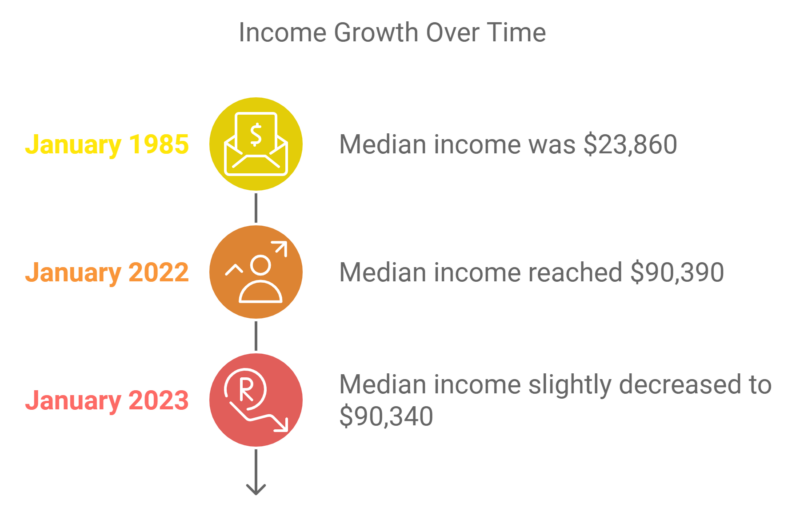
- The median household income in Minnesota was $90,340 in January 2023, slightly below the record high of $90,390 in January 2022.
- Over time, the median household income has increased significantly, rising from a historical low of $23,860 in January 1985 to the current levels in the past few years.
- This growth reflects economic changes over time, including inflation adjustments and changes in the economic landscape of the state.
The information provided is based on data from the United States Federal Reserve, with the latest update in October 2024. The median household income data can be explored further through historical charts, comparisons, and other indicators for additional context, according to Trading Economics.
The Power of Poor and Low-Income Voters in Minnesota
| Description | Data/Detail |
|---|---|
| Poor and Low-Income Eligible Voters | 1.2 million, making up 27.3% of the electorate |
| Potential Impact | If these voters turned out at the same rate as higher-income voters, they could influence election outcomes nationwide. |
There are 1.2 million poor and low-income eligible voters in Minnesota, representing over a quarter of the state’s electorate. Increasing voter turnout among this demographic could significantly impact elections across all levels of government as noted by poorpoeplecampaign.org.
Poverty
| Description | Data |
|---|---|
| Population Living in Poverty (2018-2020) | 1.7 million people, or 29.9% of the state population |
| Expanded Tax Credits in 2021 | 1.1 million children received Child Tax Credit; 288,000 workers received Earned Income Tax Credit |
| Pandemic Program Impact | The expiration of pandemic credits led to rising poverty |
Minnesota Housing Market Overview
| Metric | Value |
|---|---|
| Average Home Value | $336,954 |
| 1-Year Value Change | +1.1% |
| Days to Pending | 19 days |
| For Sale Inventory | 17,782 (August 31, 2024) |
| New Listings | 6,915 (August 31, 2024) |
| Median Sale Price | $333,633 (July 31, 2024) |
| Median List Price | $354,967 (August 31, 2024) |
| Median Sale-to-List Ratio | 1.000 (July 31, 2024) |
| Percent of Sales Over List Price | 43.5% (July 31, 2024) |
| Percent of Sales Under List Price | 35.8% (July 31, 2024) |
- The average home value in Minnesota as of August 2024 is $336,954, which represents a 1.1% increase over the past year as per Zillow.com.
- Homes typically go pending in 19 days, indicating a relatively fast-moving market.
- The median list price was $354,967, whereas the median sale price was $333,633 as of July and August 2024.
- 43.5% of home sales were over the list price, indicating high demand, while 35.8% were below the list price.
Average Rent in Minnesota (October 2024)
| Metric | Value |
|---|---|
| Average Rent | $1,291/month |
| Rent Increase (Last Year) | +1.1% |
| Average Price Increase | +$14 |
| Rent Affordability Rank | 20th least expensive in the U.S. |
| Available Rentals | 33,648 |
| A city with Lowest Rent | Walnut Grove, MN |
Apartments.com notes that the average rent in Minnesota is $1,291 per month, which increased by 1.1% from the previous year. Minnesota ranks as the 20th least expensive state for renting, with 33,648 available rental units. Walnut Grove has the lowest rent in the state.
Average Rent by Apartment Type
| Apartment Type | Average Rent ($/month) | Average Size (Sq Ft) |
|---|---|---|
| Studio | $1,093 | 474 Sq Ft |
| One Bedroom | $1,291 | 707 Sq Ft |
| Two Bedroom | $1,586 | 1,008 Sq Ft |
| Three Bedroom | $1,974 | 1,303 Sq Ft |
The average rent varies depending on the size of the apartment. Studios rent for about $1,093 per month, while a one-bedroom apartment costs around $1,291 per month. The cost increases with size—two-bedroom apartments average $1,586, and three-bedroom units go for $1,974 per month.
Health and Well-being
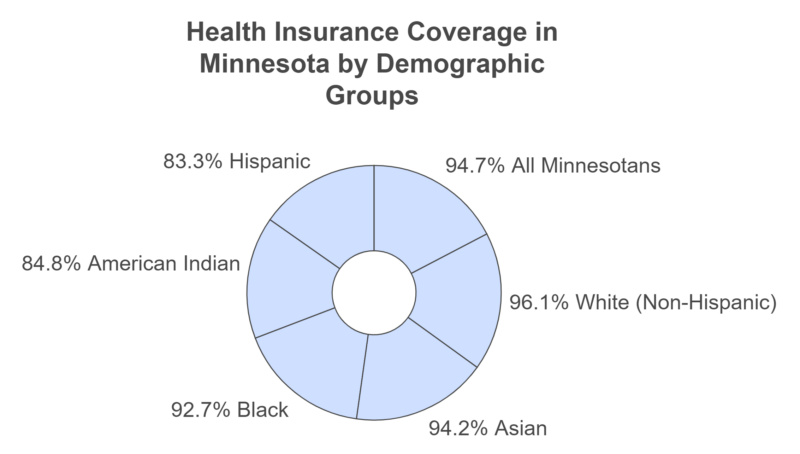
Minnesota has a high rate of health insurance coverage, with 94.7% of residents insured. However, disparities exist, with lower coverage rates among American Indian (84.8%) and Hispanic (83.3%) populations compared to White Minnesotans (96.1%).
This gap impacts healthcare access and affordability for these communities, according to Family Wise Services.
Delayed Healthcare Due to Cost (2022)
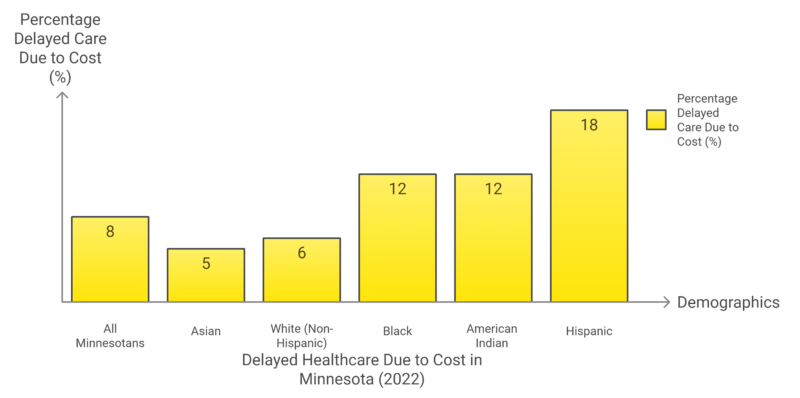
Cost is a significant barrier to healthcare, especially for Hispanics (18%), American Indians (12%), and Black Minnesotans (12%), who are more likely to delay seeing a doctor compared to the overall population (8%).
Legislative Changes in Healthcare (2023 Minnesota Legislative Session)
| Policy Change | Impact |
|---|---|
| Continuous Coverage for Children | Medical Assistance ensures 12 months of coverage for nearly 600,000 kids |
| Foster Care Youth Coverage | Former foster youth from other states covered up to age 26 |
| MinnesotaCare for Undocumented Immigrants | Undocumented immigrants are eligible starting in 2025 |
Recent legislative actions aim to expand healthcare coverage, particularly benefiting children and vulnerable groups such as former foster youth and undocumented immigrants.
Mental Health Challenges in Minnesota
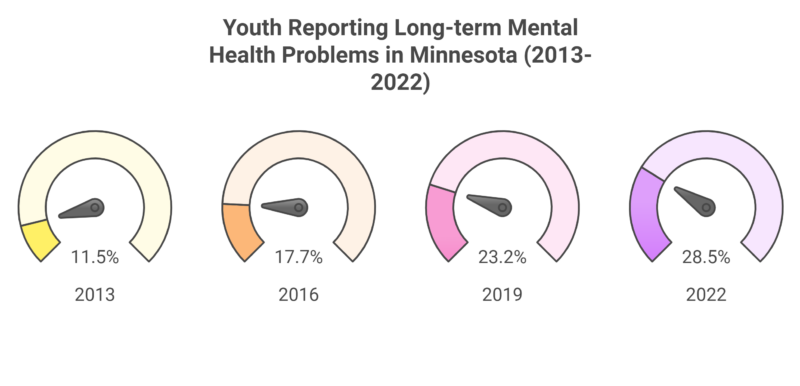
The percentage of youth experiencing long-term mental health problems in Minnesota has more than doubled over the past decade, reaching 28.5% in 2022.
Access to mental health services is hindered by complex insurance processes, long waitlists, and insufficient reimbursement rates for providers, which limit service availability.
Childcare Affordability in Minnesota
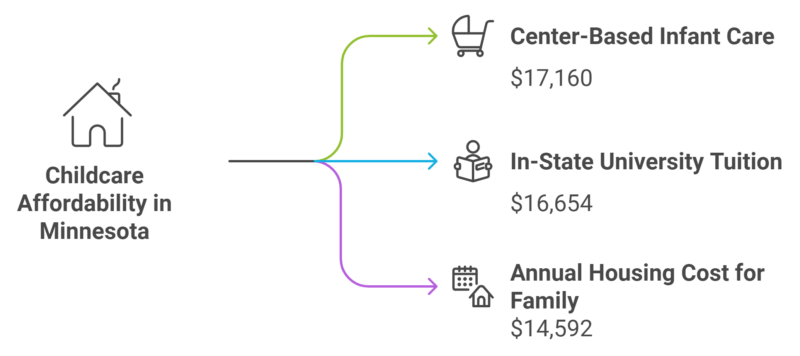
The annual cost of center-based infant care in Minnesota is $17,160, which is more expensive than in-state university tuition or the average cost of housing.
There is also a shortage of nearly 100,000 childcare openings, and 94% of families cannot afford the ideal cost of care (less than 7% of income).
The Benefits Cliff in Minnesota
| Issue | Description |
|---|---|
| Benefits Cliff | Earning a small raise can cause low-income families to lose eligibility for public assistance, preventing financial stability |
| Legislative Actions | 25 states and D.C. have addressed this issue by extending recertification periods; Minnesota has not yet acted |
The benefits cliff prevents low-income families from improving their financial situation, as minor income increases can lead to loss of assistance. Minnesota has yet to enact policies to mitigate this problem, unlike many other states.
Migration Patterns
| Year/Period | Natural Growth (Births – Deaths) | Net Migration | Total Population Change |
|---|---|---|---|
| 1957 (Peak of Natural Growth) | +57,400 | -9,300 | +48,100 |
| 2023 | +13,800 | +9,900 | +23,700 |
| 1950-1960 | High Positive Growth | Net Loss | Positive |
| 1960-1970 | High Positive Growth | Net Loss | Positive |
| 1970-1980 | High Positive Growth | Net Loss | Positive |
| 1980-1990 | High Positive Growth | Net Loss | Positive |
| 1990-2000 | Moderate Positive Growth | Net Gain | Positive |
| 2000-2010 | Moderate Positive Growth | Net Gain | Positive |
| 2010-2020 | Lower Positive Growth | Net Gain | Positive |
| Late 2040s (Projected) | Natural Decline | Net Gain | Positive (Migration-dependent) |
Population growth in Minnesota has historically been influenced by natural growth (births minus deaths) and net migration (the difference between those moving in and out of the state). For much of the last 70 years, natural growth has been the major contributor to population growth.
In 1957, natural growth added 57,400 people to the state, while migration led to a net loss of 9,300 individuals. This pattern of natural growth exceeding migration losses continued up until the 1990s.
In the 1990s, international immigration began to accelerate, and net migration became a positive contributor to the state’s population growth. By 2023, 42% of Minnesota’s population growth was attributable to migration, adding 9,900 people, whereas natural growth added only 13,800.
As the population ages, Minnesota is expected to experience a natural decline by the late 2040s, meaning deaths will outnumber births, and the state’s growth will become solely reliant on migration.
View this post on Instagram
Population Growth Trends in Minnesota
| Key Metrics | Trend/Observation |
|---|---|
| Natural Growth (Births-Deaths) | Historically dominant contributor until the 1990s; currently declining |
| Net Migration | Negative up to 1990; positive post-1990, currently increasing in impact |
| 2023 Population Growth | 42% from migration; 58% from natural growth |
| Population Aging | The increasing elderly population leads to fewer births and more deaths |
| Future Projections | Natural decline by the late 2040s, reliant on migration for growth |
| States Experiencing Natural Decline in 2023 | 19 U.S. states had more deaths than births; 8 states experienced a total population decline |
In Minnesota, natural growth has historically been a significant contributor to population increase, outpacing migration consistently until the 1990s. Since the 1990s, net migration—aided by increased international immigration- began to have a greater positive effect on the state’s population growth.
As the population continues to age, natural growth is slowing. More Minnesotans are reaching ages beyond their childbearing years, leading to a reduction in the birth rate, while mortality rates are increasing due to a larger aging population. In 2023, 42% of the state’s population growth was driven by net migration, showing an increased reliance on new residents moving into the state as natural growth wanes.
Projections indicate that Minnesota will begin to experience a natural decline by the late 2040s, meaning the population will shrink unless migration offsets the deficit. This is consistent with broader national trends, where 19 U.S. states already experienced more deaths than births in 2023, and 8 of those saw an overall population decline.
Bottom Line
The population of Minnesota reached 5.76 million in 2025 and is projected to rise slowly to 6.11 million by 2075. Migration is expected to remain the key source of growth as natural change declines and turns negative by the late 2040s.
Health coverage remains among the strongest in the country, education levels are high, and incomes continue to rise. At the same time, gaps remain for American Indian, Hispanic, and low-income groups that face unequal outcomes.
Methodology
- The information was compiled using various sources, including state demographic reports, Census Bureau data, and labor statistics.
- Data for population growth, migration trends, and housing were gathered from the official Minnesota government websites, Brainerd Dispatch, and the World Population Review.
- Employment and economic data were sourced from the U.S. Bureau of Labor Statistics. Housing values and rental statistics were obtained from Zillow and Apartments.com.
- The study also used state-specific reports like the Minnesota Office of Higher Education and Family Wise Services for insights into education and healthcare disparities.