Road rage refers to intentional assaults carried out by drivers or passengers using a vehicle or a weapon after a roadway conflict, as defined by NHTSA.
Reckless driving includes tailgating, extreme speeding, weaving across lanes, and ignoring traffic signals.
Road rage incidents have risen by roughly 500% over the past decade, signaling a serious public safety issue.
Public concern continues to grow as 63% of Americans describe aggressive driving as a major problem within their communities.
Let’s see some of the states where this issue is more common.
1. Louisiana
- 57% of fatal crashes are linked to aggressive or careless driving
- 10.17 fatalities per 100,000 residents tied directly to these behaviors
- High rates of reckless driving violations across the state
Louisiana consistently ranks among the most dangerous states for aggressive and careless driving, with fatality rates that significantly exceed national averages.
The high proportion of deadly crashes tied to reckless behavior suggests systemic issues, including lax enforcement in certain regions and a driving culture that tolerates speeding and risky maneuvers.
Dangers like these are often compounded by impaired driving, poorly maintained infrastructure, and long rural stretches where emergency response times are slower, increasing the likelihood that crashes result in fatalities.
2. New Mexico
- The highest gun-related road rage rate in the nation is at 1.56 incidents per 100,000 residents
- 7.94 fatalities per 100,000 residents caused by aggressive driving
- Rural roads and long travel distances contribute to escalated confrontations
New Mexico stands out for the dangerous overlap between road rage, aggressive driving, and firearm involvement.
Long, isolated highways encourage higher speeds and reduce the presence of law enforcement, while extended travel distances increase driver fatigue and frustration.
When conflicts arise, firearm accessibility raises the stakes, turning routine traffic disputes into potentially deadly encounters and contributing to the state’s elevated fatality rate.
3. Colorado
- 5.37 fatalities per 100,000 residents linked to reckless driving
- The highest reckless driving violation rate among the listed states is at 1.81 per 100,000
- Urban congestion and mountainous terrain increase driving complexity
Colorado’s road safety challenges stem from a combination of rapid population growth, heavy congestion in urban corridors, and demanding driving conditions in mountainous regions.
Frequent lane changes, sudden elevation shifts, and unpredictable weather require heightened driver attention, yet aggressive behaviors such as tailgating and speeding remain common.
Those are the factors that combine to increase the likelihood of serious and fatal crashes, particularly during peak travel and tourist seasons.
4. Arkansas
- Over 50% of traffic deaths are attributed to reckless driving
- 10.06 fatalities per 100,000 residents, among the highest on this list
- High-speed rural highways contribute to severe crash outcomes
In Arkansas, reckless driving is a dominant factor in traffic fatalities, especially outside urban centers.
Rural highways with higher speed limits magnify crash severity, and limited enforcement allows dangerous behavior to persist.
When serious crashes occur, delayed access to trauma care in remote areas significantly increases the risk of death, making reckless driving particularly deadly across much of the state.
5. Montana
- 6.61 fatalities per 100,000 residents are tied to aggressive driving
- Long rural stretches encourage speeding and risky overtaking
- Lower enforcement visibility reduces deterrence
Montana’s wide-open roads and low traffic density create an environment where excessive speed feels normalized.
Drivers often underestimate the danger of high-speed travel, particularly on long, straight highways with minimal enforcement presence.
When crashes do occur, they frequently involve extreme speeds, resulting in severe injuries or fatalities that drive the state’s elevated aggressive driving death rate.
6. New Jersey
- 46% of fatal crashes involve reckless driving
- 2.94 fatalities per 100,000 residents, lower but still concerning
- Heavy congestion fuels driver frustration and aggression
Despite its dense infrastructure and extensive roadway network, New Jersey struggles with aggressive driving fueled by constant congestion.
Stop-and-go traffic, frequent merging, and time pressures increase driver impatience, leading to tailgating and unsafe lane changes.
While the fatality rate is lower than in more rural states, the high share of crashes involving reckless behavior highlights persistent risks.
7. North Carolina
- 4.78 fatalities per 100,000 residents caused by aggressive driving
- 0.48 gun-related road rage incidents per 100,000 residents
- Rapid population growth has increased roadway congestion
North Carolina’s growing population has placed increasing strain on road infrastructure, particularly in suburban and urban areas.
As congestion rises, aggressive behaviors such as speeding, weaving, and unsafe lane changes become more frequent.
The presence of gun-related road rage incidents further elevates the risk, turning traffic conflicts into potentially violent situations.
For those affected by serious crashes in the region, including nearby South Carolina, legal guidance from firms like stewartlawoffices.net can be critical in navigating injury claims and understanding compensation rights after reckless driving incidents.
8. Hawaii
- 50% of fatal crashes involve aggressive or careless driving
- 3.25 fatalities per 100,000 residents
- Limited roadway infrastructure increases congestion-related stress
Hawaii’s geography limits roadway expansion, resulting in persistent congestion that heightens driver frustration.
Close vehicle spacing and frequent delays increase the likelihood of aggressive maneuvers, even during short trips.
Those conditions contribute to a disproportionately high share of fatal crashes linked to aggressive or careless driving behavior.
9. Nevada
- 27% of fatal crashes involve aggressive driving
- 3.79 fatalities per 100,000 residents
- 0.51 gun-related road rage incidents per 100,000 residents
Nevada’s traffic risks stem from the contrast between congested urban centers and vast, high-speed rural highways.
Long desert roads encourage speeding and driver fatigue, while urban areas experience congestion-driven aggression.
The combination increases both crash frequency and severity, particularly when aggressive behavior escalates into violent confrontations.
10. Florida
- 3.75 fatalities per 100,000 residents are tied to aggressive driving
- 0.41 gun-related road rage incidents per 100,000 residents
- Tourism and population growth intensify traffic volume
Florida’s year-round traffic, driven by tourism and steady population growth, creates constant roadway pressure.
Drivers frequently encounter unfamiliar roads, sudden lane changes, and heavy congestion, increasing frustration and aggressive behavior.
Speeding, tailgating, and abrupt maneuvers are common, contributing to the state’s persistent aggressive driving fatality rate.
Top U.S. Cities With the Worst Road Rage
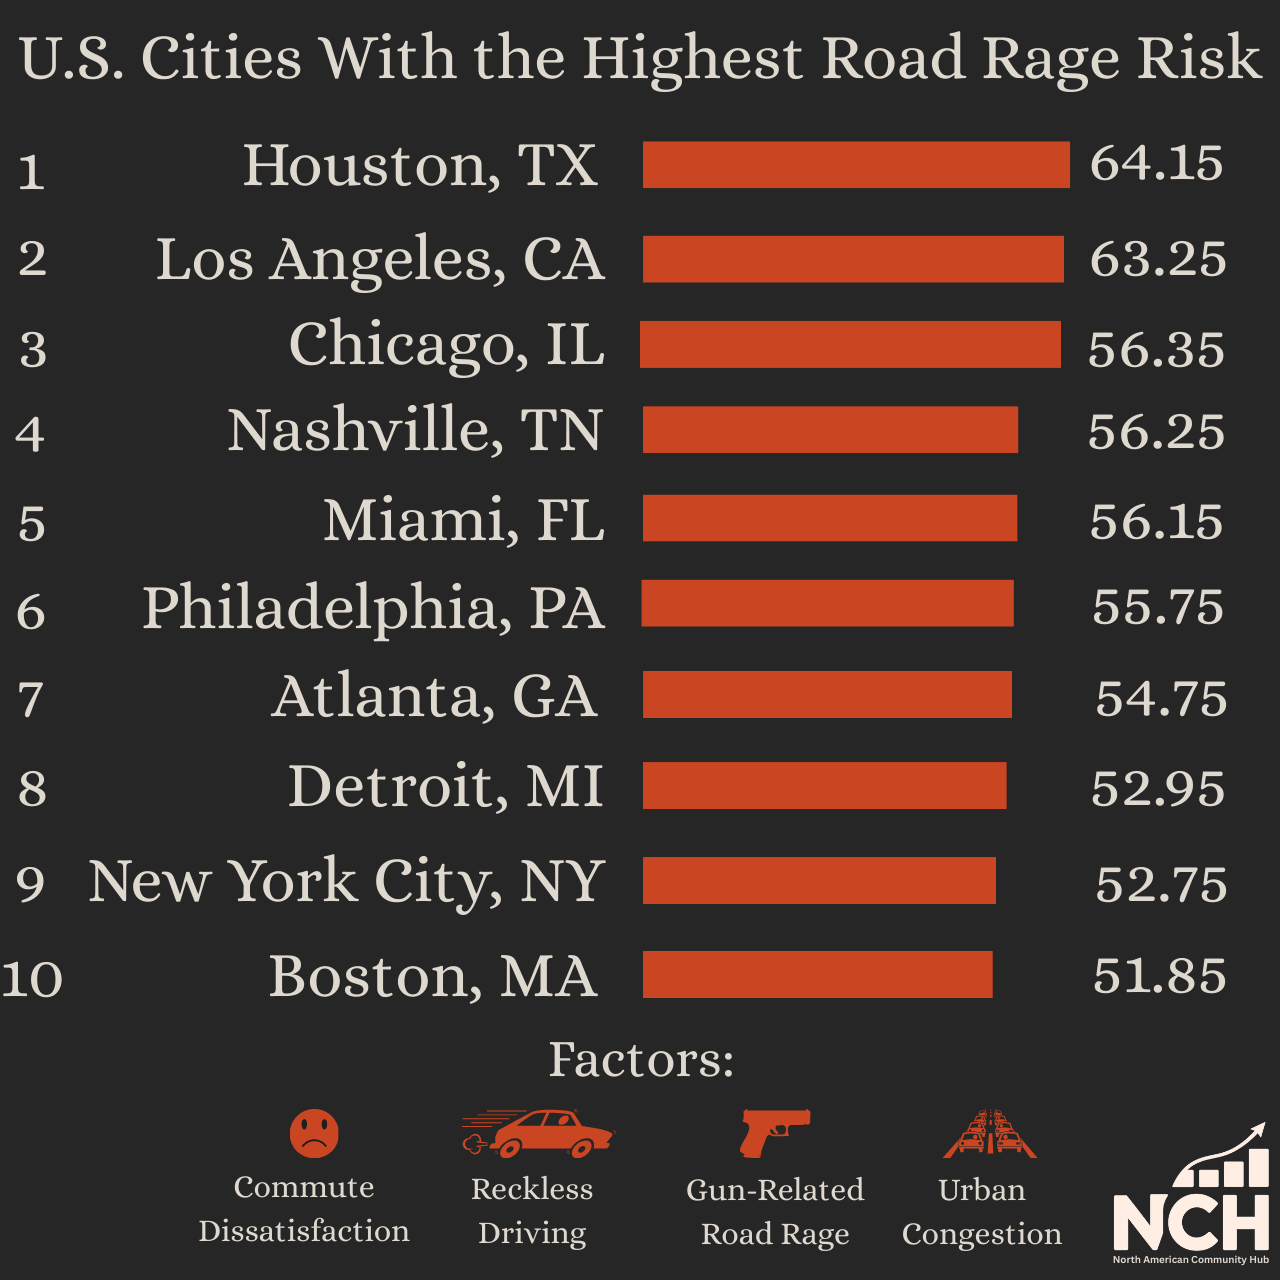
Urban environments amplify many of the factors associated with aggressive driving, and certain U.S. cities consistently rank worst for road rage severity.
Houston, Texas, leads the nation with a total road rage score of 64.15, driven by a high shooting score of 36, commute dissatisfaction of 76, and a reckless driving score of 69.
Heavy congestion, rapid population growth, and widespread highway travel contribute to elevated risk.
Los Angeles, California, follows closely with a total score of 63.25 and the highest commute dissatisfaction score nationwide at 88.
Chronic congestion, long commutes, and frequent bottlenecks create an environment where frustration builds quickly, even though the city’s shooting score remains lower at 18.
Chicago, Illinois, ranks third with a total score of 56.35, supported by a shooting score of 33 and a reckless driving score of 46. Nashville, Tennessee (56.25) and Miami, Florida (56.15) follow closely, reflecting rapid growth, heavy tourism, and increasing congestion.
Philadelphia (55.75), Atlanta (54.75), Detroit (52.95), New York City (52.75), and Boston (51.85) round out the top ten, each facing unique combinations of congestion, enforcement challenges, and aggressive driving culture.
National Trends in Road Rage and Reckless Driving
Road rage and reckless driving have become increasingly prominent contributors to traffic fatalities in the United States, reflecting broader shifts in driving behavior over the past several years.
In 2022, motor vehicle fatalities surpassed 46,000 deaths, resulting in an age-adjusted death rate of 13.3 per 100,000 residents.
That marked a substantial increase from the 2019 rate of 11.5, underscoring a troubling upward trend following the onset of the COVID-19 pandemic.
Speeding remains one of the most consistent and dangerous factors, playing a role in 27.8% of fatal crashes during 2022.
Alcohol impairment remains even more significant, contributing to 31.8% of all crash-related deaths, the highest proportion recorded since 2008, despite decades of public safety campaigns.
Interestingly enough, alcohol was among the commonest causes in 2004, with 30%.
Distracted driving continues to pose a persistent threat. Approximately 11% of all crashes involved driver distraction, with cellphone use accounting for 12.1% of distraction-related fatal crashes.
Public awareness of this danger is widespread, as 78% of Americans report viewing cellphone distraction as a major roadway concern, according to Pew Research. Despite this awareness, behavior has not meaningfully improved.
Firearm involvement has further intensified the danger. Road rage incidents involving guns peaked in 2022, resulting in 148 deaths and 421 injuries nationwide.
Elevated levels persisted into 2024, with 116 deaths reported by October, already exceeding totals from all of 2023.
Factors Fueling Road Rage and Reckless Driving
The rise in road rage and reckless driving across the United States is not driven by a single cause, but by a convergence of structural, psychological, and social pressures that increasingly shape how Americans experience daily travel.
Congested cities, mounting stress, evolving technology, and uneven enforcement have created an environment where frustration builds quickly, and self-control behind the wheel is more difficult to maintain.
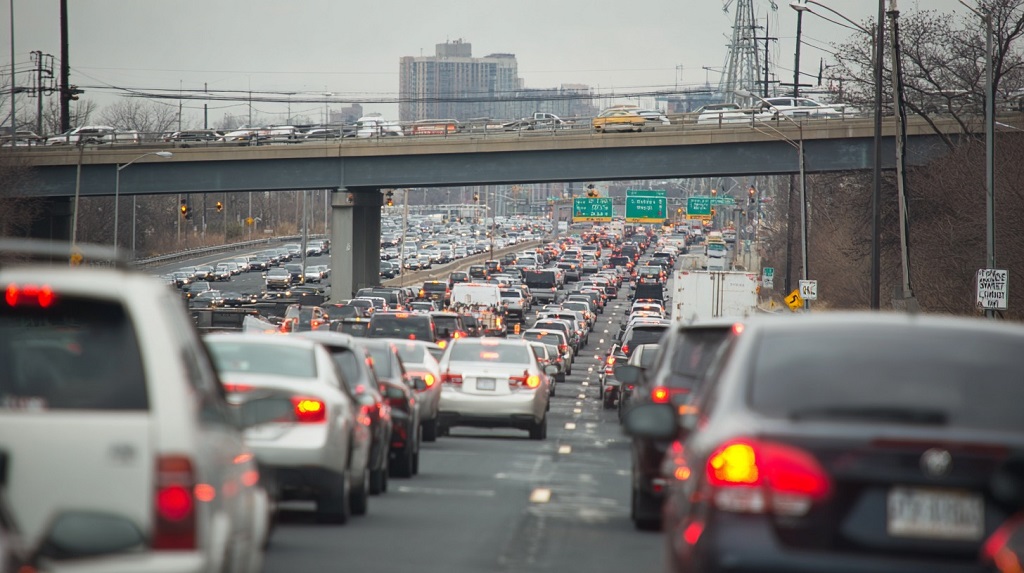
Commute Dissatisfaction and Urban Congestion
Daily commuting conditions play a central role in fueling aggressive driving, particularly in large metropolitan areas where traffic delays are both frequent and unpredictable.
Long travel times, repeated stop-and-go conditions, and the perception of lost personal time heighten emotional strain and reduce patience.
Cities that consistently rank highest for driver frustration include:
- Los Angeles
- Detroit
- Boston
- New York
Extended exposure to congestion increases cortisol levels and irritability, making drivers more likely to engage in tailgating, abrupt lane changes, and confrontational behavior.
Over time, repeated negative commuting experiences normalize aggression as a coping response, rather than an exception.
Environmental and Psychological Stressors
External driving conditions significantly influence behavior, especially when they add cognitive and emotional strain.
Environmental challenges force drivers to multitask and make rapid decisions, which lowers tolerance for mistakes made by others.
Common stress-inducing conditions include:
- Driver fatigue from long commutes or irregular work schedules
- Extreme weather such as heavy rain, snow, heat, or fog
- Construction zones, lane closures, and frequent detours
When mental load increases, drivers are more likely to misinterpret minor inconveniences as personal slights, escalating routine situations into aggressive responses.
Those Conditions also increase the likelihood of risk-taking, such as speeding to “make up time” or unsafe passing maneuvers.
Social and Emotional Pressure
Broader societal stress has increasingly spilled into driving behavior.
Emotional regulation has weakened for many individuals as financial strain, job insecurity, and social tension remain elevated compared to pre-2020 levels.
Survey data and behavioral studies indicate that:
- Many drivers report feeling less patient and more reactive than before the pandemic
- Emotional sensitivity has increased, particularly during high-stress routines like commuting
Driving often becomes an emotional outlet, where frustration accumulated elsewhere is released in moments of perceived provocation.
Technology, Distraction, and Frustration
Modern vehicle technology has introduced new cognitive demands that both distract and frustrate drivers.
While navigation tools and in-car systems are designed to improve efficiency, they frequently interrupt attention and elevate stress levels.
When drivers are already stressed, even minor technological disruptions can provoke irritation, contributing to impulsive decisions and aggressive responses toward other motorists.
Inconsistent Traffic Enforcement and Reduced Deterrence
The perceived absence of consequences plays a critical role in the persistence of reckless driving behavior.
In many regions, drivers encounter minimal enforcement presence, which weakens behavioral deterrence over time.
In areas with limited enforcement visibility:
- Repeat offenders face fewer immediate consequences
- Risky behaviors such as speeding and aggressive lane changes become normalized
When drivers believe that violations are unlikely to be punished, aggressive habits escalate and spread socially.
Summary
Road rage and reckless driving have evolved from isolated behavioral issues into a widespread public safety crisis shaped by modern commuting realities, social stress, and systemic gaps in prevention.
Rising fatality rates, persistent aggressive behavior, and the growing involvement of firearms demonstrate that this is no longer just a matter of individual impatience, but a reflection of broader structural and cultural pressures affecting drivers nationwide.
Congested urban environments, long and unpredictable commutes, and mounting psychological stress have steadily eroded patience behind the wheel.
At the same time, technological distractions and inconsistent traffic enforcement have reduced accountability, allowing dangerous behaviors to become normalized.