The synchronized collapse across precious metals, cryptocurrencies, and equities reveals something far more troubling than a simple market correction. It exposes the fragile mechanical underpinnings of modern finance, where leverage, margin calls, and algorithmic systems can transform a minor price movement into a systemic crisis.
When Everything Breaks at Once: The Synchronized Collapse
Friday, January 30th, 2026, will be remembered as the day when the interconnectedness of global financial markets became impossible to ignore. What unfolded wasn’t a typical market correction where different asset classes move in their own directions based on their own fundamentals. Instead, we witnessed something far more unsettling: a synchronized collapse across virtually every major asset class within a few hours.
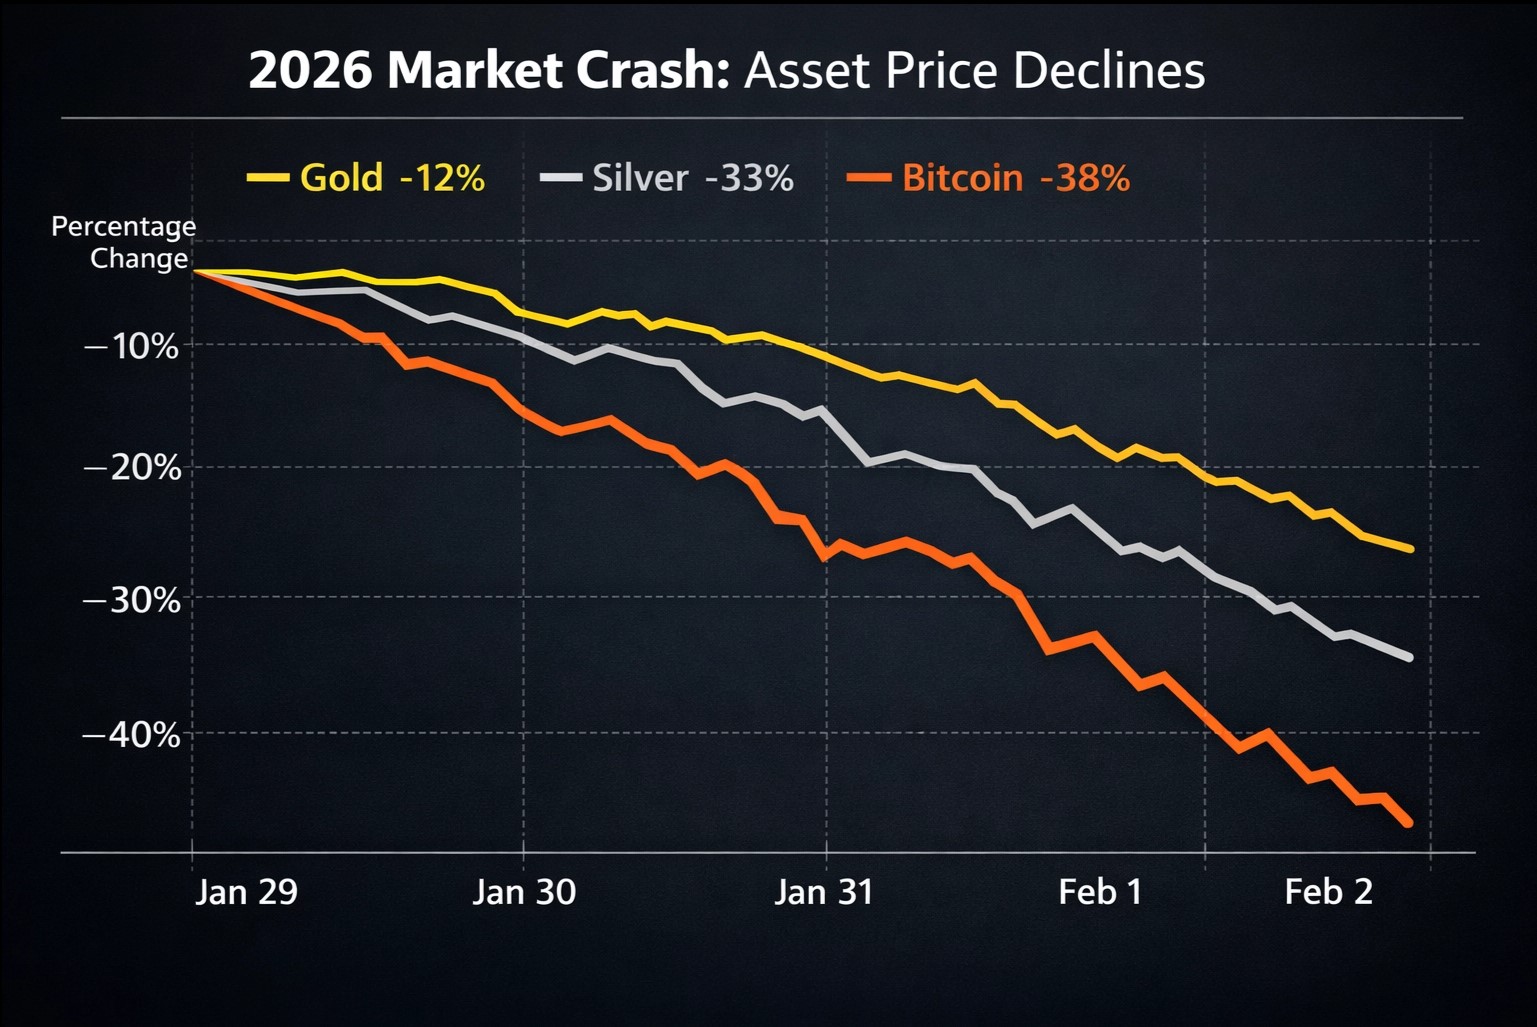
Gold, which had been climbing steadily throughout 2025 on the back of geopolitical tensions and central bank diversification concerns, plummeted 12% in a single trading session. For context, a 12% daily move in gold is scarce. The metal is supposed to be the ultimate haven, the thing you own when you don’t trust anything else. Yet there it was, getting hammered along with everything else.
Silver told an even more dramatic story. The white metal crashed 33% in a single day—its worst performance since March 1980, when the Hunt brothers’ attempt to corner the silver market spectacularly imploded.
According to CNBC, traders who had positioned themselves for a continued precious metals rally found themselves facing margin calls they couldn’t cover. The selling became indiscriminate and panic-driven.
Meanwhile, Bitcoin had already begun its own descent the day before. What started as a drop from $88,000 to below $85,000 on January 29th accelerated into a full-blown rout. By the weekend, Bitcoin was trading around $77,000, representing a loss of roughly $800 billion in market value in just a few days. That’s not a correction—that’s a wipeout of historic proportions.
And then the contagion spread to equities. Stock markets around the world joined the selloff. The S&P 500 futures opened sharply lower on Monday morning, down 1.1%. The Dow Jones futures were down 0.9%. Technology stocks, which had been the darlings of the market just weeks earlier on artificial intelligence enthusiasm, were getting hit particularly hard.
The Reuters reporting confirms that the global selloff was synchronized across all major exchanges, suggesting a systemic issue rather than localized concerns.
CHART: Asset Price Movements During the Crash – Shows Gold (-12%), Silver (-33%), Bitcoin (-38%) from Jan 29 to Feb 2, 2026
The Real Story: Mechanical Failure, Not Fundamental Repricing
When you dig into the actual market mechanics, something striking emerges that most financial commentators missed entirely. The crash wasn’t driven by a sudden realization that precious metals or cryptocurrencies were overvalued. Instead, it was driven by the mechanical structure of leveraged markets and the cascade of forced liquidations that followed.
According to detailed analysis from Investing.com, 79% of the crash in precious metals resulted from mechanical factors—forced liquidations, margin calls, and algorithmic trading cascades. Only about 21% reflected a genuine reassessment of these assets’ fundamental value. This is a critical distinction that changes everything about how we should interpret what happened.
This distinction matters enormously for investors trying to figure out what to do next. A mechanical crash is fundamentally different from a fundamental repricing. When a market crashes because the underlying thesis has broken, you need to reconsider your entire investment approach. But when a market crashes because overleveraged positions are being forcibly liquidated by brokers, that’s a different animal entirely. It’s painful, but it’s also often temporary.
Think of it this way: imagine you own a house that you believe is worth $500,000. You borrowed $400,000 against it at a variable interest rate. If interest rates spike suddenly, your monthly payment might become unaffordable. You’d be forced to sell the house, not because you suddenly think it’s only worth $300,000, but because you can’t service the debt. The house didn’t change. Your financial situation did. That’s exactly what happened in the precious metals markets on January 30th.
The Trigger: A Cryptocurrency Liquidation Cascade That Started Everything
To understand how this all started, you need to go back to January 29th and look at what happened in the cryptocurrency futures markets. Bitcoin had been on a tear, climbing from around $42,000 in mid-2024 to above $126,000 by October 2025. That kind of rally attracts leverage like moths to a flame. Traders borrowed heavily to amplify their exposure, betting that the bull market would continue indefinitely.
But on January 29th, something spooked the market. Bitcoin fell from above $88,000 to below $85,000 in a matter of minutes. That might not sound like much—it’s only about a 3.5% move—but in the leveraged futures markets, a 3.5% move is catastrophic. Traders who had borrowed 5x or 10x to amplify their exposure suddenly found themselves facing liquidation.
The numbers tell the story. According to data from CoinDesk, $1.68 billion in cryptocurrency positions were liquidated on January 29th alone. That’s the largest single-day liquidation since the FTX collapse in November 2022. And critically, 93% of those liquidations were long positions being forcibly closed—meaning traders who had bet on prices going up were getting wiped out.
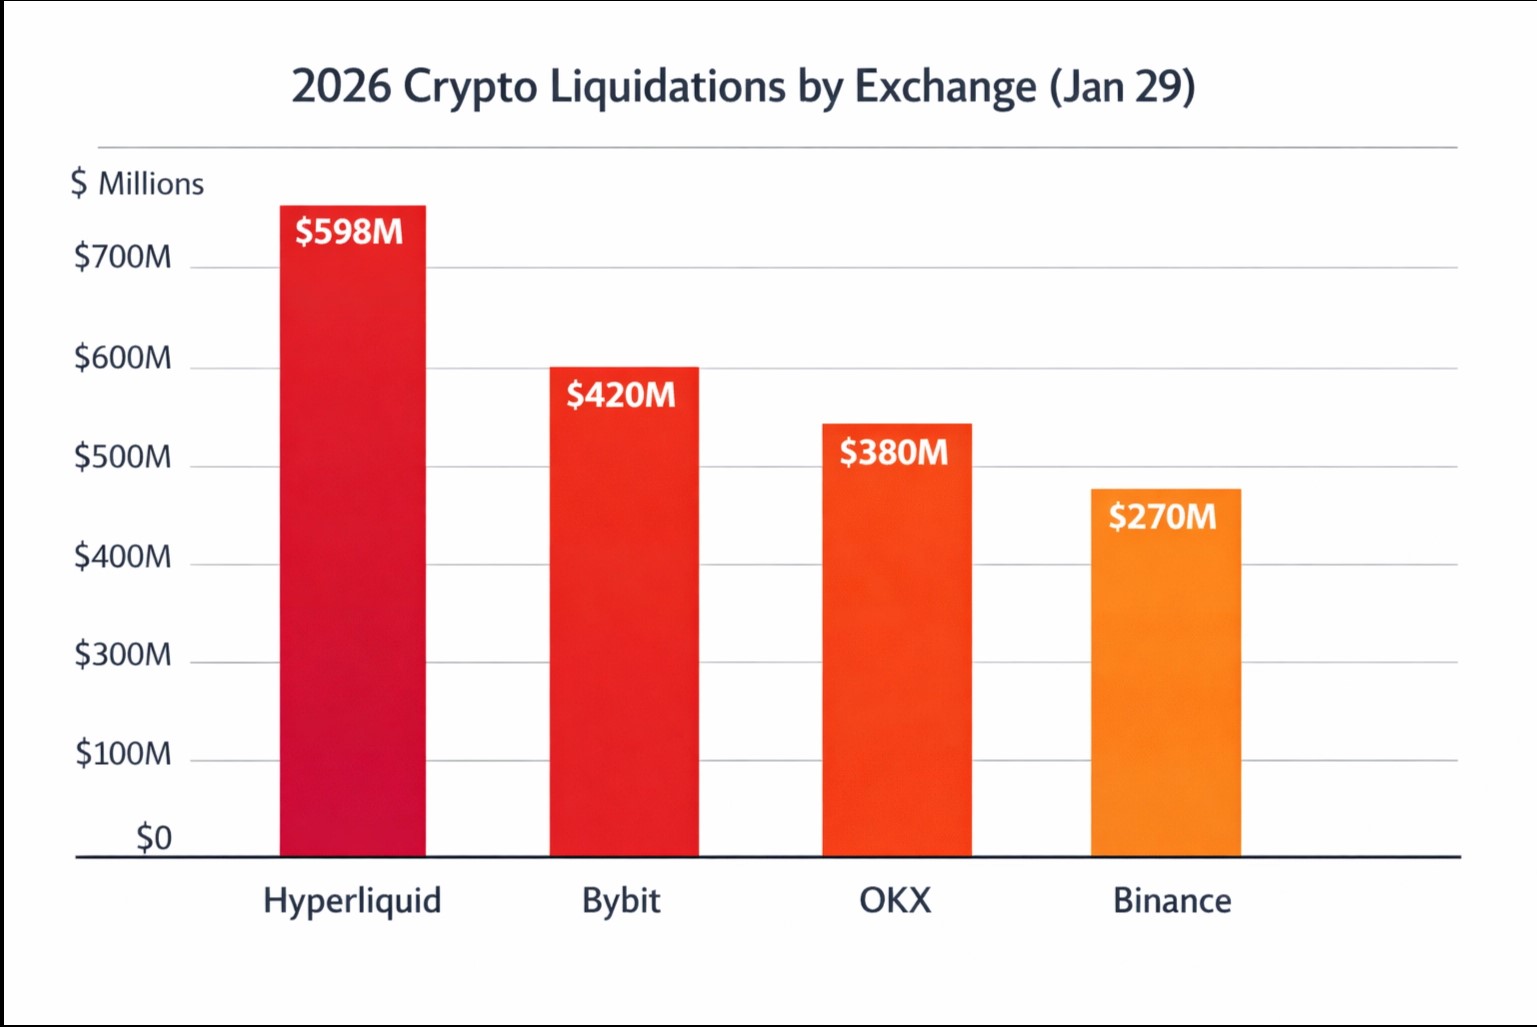
Hyperliquid, one of the largest cryptocurrency derivatives exchanges, saw $598 million liquidated in a single day. Bybit, another major exchange, reported similar levels of carnage. The liquidations weren’t concentrated in any one exchange—they were happening everywhere simultaneously, suggesting a systemic issue rather than a localized problem.
CHART: Cryptocurrency Liquidations by Exchange – Hyperliquid ($598M), Bybit ($420M), OKX ($380M), Binance ($270M)
| Exchange | Liquidations (USD) | % of Total |
|---|---|---|
| Hyperliquid | $598 Million | 35.6% |
| Bybit | $420 Million | 25.0% |
| OKX | $380 Million | 22.6% |
| Binance | $270 Million | 16.1% |
| TOTAL | $1,680 Million | 100% |
The Portfolio Margin Connection: How Crypto Crashed Gold
Now here’s where the story gets really interesting, and where most financial commentators got it completely wrong. The obvious question is: why would a cryptocurrency crash cause precious metals to crash? These are completely different markets. Gold is traded by central banks and institutional investors. Bitcoin is traded by retail speculators and tech enthusiasts. They shouldn’t be correlated. It seems they are not as reliable as passive income investments as they were in previous years, especially Bitcoin.
But they are correlated, and the reason has to do with something called “portfolio margin accounts.” These are sophisticated trading accounts, typically used by hedge funds and professional traders, that treat all your positions—whether they’re in cryptocurrency, precious metals, stocks, or anything else—as one unified pool of collateral.
Here’s how it works in practice. Let’s say a hedge fund has $100 million in assets. They might have $40 million in Bitcoin, $30 million in gold futures, and $30 million in stock index futures. The broker looks at all of this as one portfolio and calculates the total risk. If the portfolio is well-diversified, the broker might allow the hedge fund to use only $50 million of collateral to hold all of these positions—essentially giving them 2x leverage on their entire portfolio.
This works fine as long as the portfolio doesn’t move too much in any one direction. But when Bitcoin crashes 3.5% in a matter of minutes, that $40 million position suddenly becomes worth $38.6 million. The portfolio’s total value drops. The broker looks at the portfolio and says: You need to post more collateral immediately, or I’m liquidating positions to bring you back into compliance.
Now here’s the critical part: the hedge fund can’t sell its Bitcoin to raise cash because Bitcoin is in freefall. Selling into a market that’s collapsing would mean realizing massive losses. Instead, they need to sell whatever assets they can sell without further crashing prices. And during Asian trading hours when the crisis was intensifying, precious metals markets offered superior liquidity compared to the collapsing cryptocurrency markets.
A trader could dump $1 million in gold futures in seconds without significantly moving the price. But trying to sell $1 million in Bitcoin when the market is already in freefall? That would just push prices down even further and trigger more liquidations. So the rational choice, from the hedge fund’s perspective, was to sell gold to cover the Bitcoin losses.
Industry sources and market participants estimate that between $500 million and $1 billion in precious metals were sold purely to cover Bitcoin-related margin calls. That represented roughly 2-3% of gold’s total 12% decline on the day. In other words, 2-3% of the crash in gold had absolutely nothing to do with any change in gold’s fundamental value. It was purely mechanical—a forced sale to cover losses in a completely different asset class.
The Setup: Regulators Quietly Loading the Gun
But the cryptocurrency liquidations alone wouldn’t have caused such a catastrophic crash if the market hadn’t already been primed for it. And that’s where the regulatory story comes in—a story that few people have connected to the crash.
In the weeks leading up to January 30th, three separate regulatory bodies across three different continents simultaneously tightened margin requirements on metals and equities markets.
| Regulator | Date | Asset | Change |
|---|---|---|---|
| CME Group | Jan 27-29 | Gold/Silver Futures | +10% to +25% |
| Shanghai Gold Exchange | Dec 30 | Gold/Silver | +1% to +41% |
| China Securities | Jan 14 | Stock Margins | 80% → 100% |
| Multiple | Jan 29-30 | Post-Crash | Further Increases |
The CME Group, which operates the largest precious metals futures markets in the United States, raised the cash required to hold silver contracts by 25% and gold contracts by 10% in the days before January 29th. For a trader carrying 100 silver contracts, this suddenly meant a $1.2 million bill to maintain their position—cash most traders didn’t have readily available. The CME followed up with additional increases after the Friday crash, raising gold futures margins from 6% to 8% and silver futures margins from 11% to 15%.
On December 30th, the Shanghai Gold Exchange implemented its own margin increases, raising gold margins from 16% to 17% and silver margins from 19% to 20%. But more significantly, they spiked the cash requirement per lot by 41%. Chinese retail traders, who had been leveraged to the hilt after silver’s 56% rally in recent months, were forced to liquidate positions during the first week of January.
Then, on January 14th, China’s securities regulators increased stock market margin requirements from 80% to 100%. This created a wave of margin calls across stock trading accounts. Brokers who had been using precious metals as collateral for stock lending faced an impossible choice: sell stocks at depressed prices or dump their metals holdings. Many chose to sacrifice metal positions.
So by the time Bitcoin crashed on January 29th, the market was already fragile. Chinese retail leverage had been washed out. Western institutional leverage was peaking just as the CME hikes took effect. When the Warsh nomination news provided a psychological excuse to sell on January 30th, overleveraged positions across three continents detonated simultaneously.
The Amplification: When Algorithms Made It Exponentially Worse
Once the initial selling began, the mechanical structure of derivatives markets transformed what might have been a manageable correction into a catastrophic crash. Two algorithmic mechanisms amplified the decline: gamma squeeze dynamics and algorithmic stop-loss hunting.
Let’s start with gamma squeezes. During gold’s rally to record highs, options dealers had sold massive quantities of call options at strike prices like $5,000, $5,100, and $5,200. These were bets that gold wouldn’t go above those levels. To hedge their risk as prices climbed, these dealers were forced to buy futures contracts. This mechanical buying pushed prices higher in a self-reinforcing loop—a classic gamma squeeze to the upside.
But these same mechanics operate in reverse during declines. When prices collapsed back through those strike levels on January 30th, dealers were forced to sell futures to unhedge their positions. Their selling drove prices down further, which triggered even more dealer selling, creating a self-feeding downward spiral. According to Goldman Sachs analysis, this gamma loop added 2-3% to both the preceding rally and the subsequent crash.
Then there’s algorithmic stop-loss hunting. Trading algorithms deliberately target psychologically important price levels like $5,100, $5,000, and $4,980, knowing that many traders place automatic sell orders at these round numbers. When algorithms push prices through these levels, they trigger waves of automatic selling, which drives prices even lower and triggers the next layer of stop-losses.
The evidence for this is visible in the actual price action. Prices didn’t fall smoothly but instead dropped in discrete, stair-step patterns with 60-second bursts of extreme volume at each major level. This pattern is inconsistent with human panic selling but perfectly matches algorithmic systems hitting pre-programmed targets while gamma mechanics amplified each move.
Market Infrastructure Failure: When the ETF Market Broke Down
Perhaps the clearest evidence that this was a mechanical failure rather than a fundamental repricing came from the ETF market, where the infrastructure that normally keeps prices aligned simply stopped functioning.
The iShares Silver Trust (SLV) normally trades within 0.5% of the net asset value of the physical silver it holds. It’s one of the most liquid ETFs in the world. During the Friday crash, this premium exploded to 3.3%—meaning the ETF was trading 3.3% higher than the actual value of its underlying silver.
In a functioning market, specialized traders called authorized participants would immediately create new ETF shares and pocket the 3.3% difference, bringing prices back into alignment within minutes. The fact that a 3.3% premium persisted for hours means one thing: the market makers walked away. They stopped creating new shares. Liquidity simply vanished.
Retail investors trying to sell SLV at $80 during the crash couldn’t obtain fair prices. They lost 3.3% purely on execution—real money lost, not because silver’s price changed, but because the market infrastructure failed to function.
The GLD (gold ETF) experienced similar dysfunction, with bid-ask spreads blowing out to 5-7 basis points compared to its typical razor-thin spreads.
How the Crash Spread to Equities?
The spread to equities wasn’t immediate or obvious. At first, it seemed like precious metals and crypto were having their own problems. But by Monday morning, it became clear that the contagion had spread to the broader market.
According to Bloomberg reporting, the stock market selloff was driven by several factors: forced selling from hedge funds that had used equities as collateral for their precious metals positions, algorithmic systems that detected weakness and triggered systematic selling programs, and genuine fear about what the crash meant for the broader economy.
The Economic Times reported that the S&P 500 fell 1.1% on Monday, with technology stocks down 1.8%. This was particularly notable because tech stocks had been the market leaders, and their weakness suggested that investors were taking risk off the table across the board.
What Does This Mean for Investors Going Forward?
The 2026 market crash represents a mechanical breakdown rather than a fundamental shift in long-term investment theses. This distinction matters profoundly for investment decision-making.
The structural drivers supporting precious metals remain solid. Central banks continue diversifying away from dollar-denominated assets. Fiscal concerns about government spending persist. Silver faces genuine supply constraints that haven’t changed. Similarly, the case for cryptocurrency based on institutional adoption and regulatory clarity hasn’t fundamentally shifted. The crash flushed out excessive leverage and speculative positioning, but the underlying thesis for long-term adoption remains.
The crash served as a necessary reset, flushing out weak, overleveraged positions that had made markets fragile. The next rally, when it emerges, will be built on a foundation of surviving holders rather than overleveraged speculators—a healthier market structure for sustainable growth.
“The thesis didn’t break. The leverage did.” — Market participants reflecting on the crash mechanics
For investors, the critical lesson is recognizing the difference between mechanical liquidation and fundamental repricing. When 79% of a crash stems from forced selling, margin calls, and algorithmic amplification rather than changed fundamentals, the appropriate response isn’t panic but patience and potentially opportunistic accumulation at depressed prices.
While there are some ups and downs(mostly downs) for investment assets, the real estate market remains stable in the US, especially in states like California, Texas, and Pennsylvania.
Timeline: How It All Unfolded
December 30, 2025 – Shanghai Exchange Tightens Margins
Shanghai Gold Exchange raises gold margins from 16% to 17% and silver from 19% to 20%, with cash requirement per lot spiking 41%. Chinese retail traders begin forced liquidations.
January 14, 2026 – China Securities Regulators Increase Stock Margins
Stock market margins rose from 80% to 100%, creating a wave of margin calls. Brokers begin dumping precious metals collateral to cover stock lending.
January 29, 2026 – Bitcoin Crash Triggers Crypto Liquidations
Bitcoin falls from $88,000 to below $85,000 in minutes. $1.68 billion in forced cryptocurrency liquidations across all major exchanges—largest since FTX collapse.
January 30, 2026 – Precious Metals Rout
Gold crashes 12% to below $5,000. Silver plummets 33% to $85.30 (worst day since March 1980). Stock markets decline globally. ETF market infrastructure breaks down.
January 31 – February 1, 2026 – Weekend Cascade
Bitcoin continues falling to $77,000 in thin weekend liquidity. $2.5 billion in additional cryptocurrency liquidations. Nearly 200,000 traders liquidated across crypto exchanges.
February 2, 2026 – Stock Market Contagion
S&P 500 futures down 1.1%, Dow futures down 0.9%. Precious metals continue declining. Contagion spreads from commodities to equities as risk-off sentiment dominates.
Sources & References
[1] CNBC (February 2, 2026)https://www.cnbc.com/2026/02/02/gold-silver-sell-off-historic-plunge-.html
“Gold dives 5% and silver crashes 7%, extending sell-off in precious metals after historic plunge.”
[2] Investing.com (February 2, 2026)
https://www.investing.com/analysis/golds-12-crash-how-17-billion-in-crypto-liquidations-tanked-precious-metals-200674247
“Gold’s 12% Crash: How $1.7 Billion in Crypto Liquidations Tanked Precious Metals.”
[3] CoinDesk (February 2, 2026)
https://www.coindesk.com/markets/2026/02/01/this-is-absolutely-insane-bitcoin-s-weekend-crash-exposes-the-cracks-beneath-crypto-s-latest-boom
“Bitcoin’s weekend crash exposes the cracks beneath crypto’s latest boom.”
[4] Reuters (February 2, 2026)
https://www.reuters.com/world/asia-pacific/global-markets-selloff-investors-instant-view-2026-02-02/
“Global markets selloff: Investors’ instant view.”
[5] Bloomberg (February 1, 2026)
https://www.bloomberg.com/news/articles/2026-02-01/dollar-firms-stocks-look-weaker-as-sentiment-ebbs-markets-wrap
“Dollar firms, stocks look weaker as sentiment ebbs.”
[6] Economic Times (February 2, 2026)
https://m.economictimes.com/news/international/us/sp-500-doe-jones-crash-on-monday-as-u-s-stock-market-investors-worry-over-donald-trumps-shocking-move/articleshow/127857838.cms
“S&P 500, Dow Jones crash on Monday.”
[7] CME Group
https://www.cmegroup.com
Official margin requirement announcements and precious metals futures data.
[8] Shanghai Gold Exchange
https://www.sge.com.cn
Margin requirement updates and Chinese precious metals market data.
[9] Goldman Sachs
https://www.goldmansachs.com
Quantitative research on gamma squeeze dynamics and market analysis.
[10] Federal Reserve
https://www.federalreserve.gov
Policy statements and monetary policy guidance.
[11] iShares Silver Trust (SLV)
https://www.ishares.com/us/products/239855/ishares-silver-trust-etf
ETF product information and real-time pricing data.
[12] iShares Gold Trust (GLD)
https://www.ishares.com/us/products/239561/ishares-gold-trust-etf
ETF product information and real-time pricing data.
