Birth rate refers to the number of live births per 1,000 people recorded each year.
Fertility rate measures births per 1,000 women in childbearing years, commonly ages 15 to 44 or up to 50 depending on the dataset.
Monitoring these figures supports planning for schools, housing demand, healthcare systems, and labor markets. Shifts in fertility often signal future changes in consumer behavior and public spending priorities.
Recent federal initiatives, such as proposed Trump Accounts, focus on early-life financial support and long-term savings for children. Policy signals of this type can influence family planning decisions, particularly in states already showing strong birth trends.
Now we will present the leading U.S. states in birth and fertility rates, focusing on per capita performance rather than raw population size.
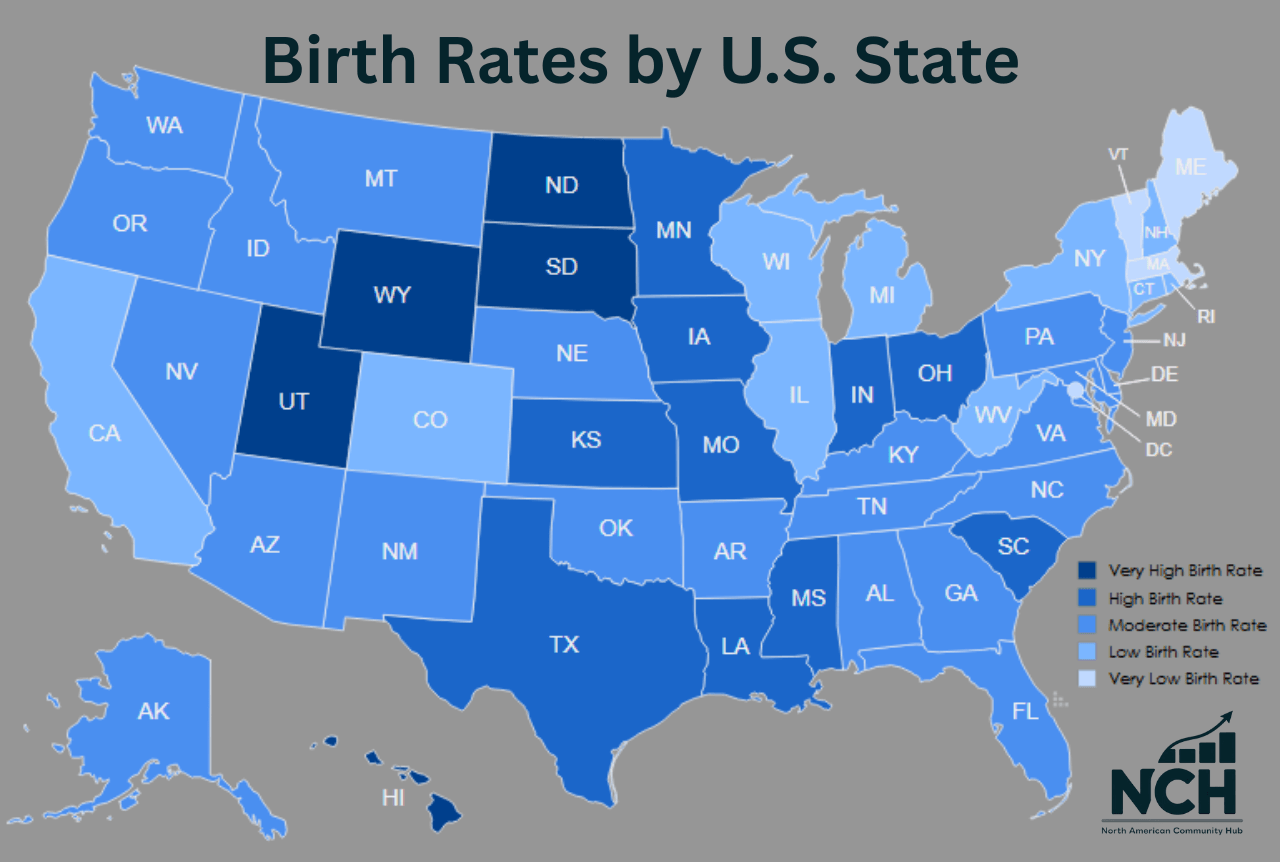
| Rank | State | Birth Rate |
| 1 | Wyoming | 66 |
| 2 | Hawaii | 63 |
| 3 | South Dakota | 63 |
| 4 | North Dakota | 60 |
| 5 | Utah | 60 |
| 6 | Indiana | 57 |
| 7 | Iowa | 56 |
| 8 | Louisiana | 56 |
| 9 | Minnesota | 56 |
| 10 | Mississippi | 56 |
| 11 | Kansas | 55 |
| 12 | Missouri | 55 |
| 13 | Ohio | 55 |
| 14 | South Carolina | 55 |
| 15 | Texas | 55 |
| 16 | Delaware | 54 |
| 17 | Kentucky | 54 |
| 18 | Montana | 54 |
| 19 | Nebraska | 54 |
| 20 | Oklahoma | 54 |
| 21 | Maryland | 53 |
| 22 | Nevada | 53 |
| 23 | Tennessee | 53 |
| 24 | Virginia | 53 |
| 25 | Washington | 53 |
| 26 | Alaska | 52 |
| 27 | Arkansas | 52 |
| 28 | Georgia | 52 |
| 29 | New Jersey | 52 |
| 30 | New Mexico | 52 |
| 31 | Pennsylvania | 52 |
| 32 | Alabama | 51 |
| 33 | Arizona | 51 |
| 34 | Florida | 51 |
| 35 | Idaho | 51 |
| 36 | North Carolina | 51 |
| 37 | New York | 49 |
| 38 | California | 48 |
| 39 | Colorado | 48 |
| 40 | Connecticut | 48 |
| 41 | Illinois | 48 |
| 42 | Michigan | 48 |
| 43 | West Virginia | 48 |
| 44 | Wisconsin | 48 |
| 45 | New Hampshire | 45 |
| 46 | Rhode Island | 45 |
| 47 | Massachusetts | 44 |
| 48 | Maine | 43 |
| 49 | Oregon | 43 |
| 50 | District of Columbia | 39 |
| 51 | Vermont | 39 |
1. Wyoming

Wyoming leads all states with a birth rate of 66 births per 1,000 women.
Total births reached 8,487 in 2023, a modest number in raw terms but extremely strong on a per capita basis.
Small population size magnifies fertility performance and places Wyoming at the top nationally, even when compared with much larger states.
- Birth rate of 66 per 1,000 women ranks highest nationally
- Small statewide population amplifies per capita outcomes
- Consistently high fertility across both rural counties and small towns
Family-centered values play a major role in shaping household decisions. Rural living patterns encourage earlier marriage and child-rearing compared to heavily urbanized states.
Lower housing density allows families to access larger homes and land at a lower relative cost.
Smaller communities often provide informal childcare support, close social ties, and stronger intergenerational relationships, reinforcing consistently high fertility levels across the state.
2. Hawaii
Hawaii reports a birth rate of 63 births per 1,000 women, with 19,310 total births recorded.
- Key fertility indicators help explain Hawaii’s placement.
- Birth rate of 63 per 1,000 women exceeds national averages
- Over 19,000 births annually despite high living costs
Cultural traditions emphasize close family relationships and collective responsibility.
Multigenerational households remain common, reducing childcare burdens and easing housing constraints for young parents.
Extended family involvement allows many couples to pursue parenthood earlier or have additional children despite financial challenges.
Strong social cohesion within local communities continues to support fertility levels that remain above national norms.
3. South Dakota

South Dakota also posts a birth rate of 63 births per 1,000 women, supported by 12,659 total births.
Rural lifestyles dominate much of the state and continue to favor larger family sizes across generations.
- Birth rate matches Hawaii at 63 per 1,000 women
- Rural counties account for a large share of total births
Agricultural communities often view children as central to family life and long-term continuity.
Early marriage and child-rearing remain socially encouraged. Community institutions such as churches, schools, and local organizations provide strong support networks for young families.
Fertility trends remain stable across both small cities and rural counties, limiting sharp demographic decline.
4. North Dakota
North Dakota maintains a birth rate of 60 births per 1,000 women with 10,805 total births.
Demographic structure contributes significantly, as a relatively young population base sustains higher fertility across multiple age groups.
- Birth rate of 60 per 1,000 women supports population replacement
- Younger age distribution compared to many peer states
Replacement rate projections frequently place North Dakota near the top nationwide.
Employment stability tied to energy production, agriculture, and manufacturing supports confidence in family planning.
Economic opportunity, combined with lower unemployment, encourages long-term settlement and household growth rather than short-term migration.
5. Utah

Utah records a birth rate of 60 births per 1,000 women and produced 52,625 total births.
Cultural and religious influences continue to shape expectations around family size and timing across much of the population.
- One of the youngest median ages nationally
- Births per capita projected among the highest for 2025
Marriage occurs earlier than the national average, contributing to longer childbearing windows. Younger median age supports higher fertility over time.
Strong community connections and organized family support systems help maintain consistent birth patterns year after year.
6. Indiana
Indiana shows a birth rate of 57 births per 1,000 women, with total births reaching 90,077.
Results stand out for a Midwestern state with a large industrial and manufacturing base.
- A large share of women within the prime childbearing ages
- Nearly 90,000 births annually reflect both scale and fertility strength
Traditional family values remain influential across both urban and suburban regions.
Moderate living costs reduce financial barriers to child-rearing.
Stable employment markets encourage long-term household formation, supporting steady fertility rather than sharp fluctuations.
7. Iowa

Iowa reports a birth rate of 56 births per 1,000 women and logged 40,480 births.
Rural family structures continue to support consistent fertility levels across much of the state.
- Lower youth outmigration compared to neighboring states
- Stable employment tied to agriculture, healthcare, and manufacturing
Stable local economies reduce financial uncertainty for young families.
Community rootedness encourages long-term residence, supporting sustained childbearing across multiple age cohorts rather than short-term spikes tied to migration shifts.
8. Louisiana
Louisiana rounds out the list with a birth rate of 56 births per 1,000 women and 59,199 total births.
Southern cultural norms align closely with higher fertility outcomes across both urban and rural areas.
- Birth rate remains elevated relative to national figures
- Nearly 60,000 births annually sustain population levels
Strong community ties and extended family involvement remain influential.
Cultural emphasis on kinship and shared responsibility reduces childcare pressures for young parents.
Socioeconomic patterns combined with deep social connections continue to support higher birth rates relative to national averages.
Trends and Insights
Understanding the factors that drive high birth rates across U.S. states requires looking beyond raw numbers.
Fertility patterns are influenced by a combination of cultural norms, economic conditions, age demographics, and social support systems.
1. Fertility and Geography: Rural States Lead
Rural and Midwestern states consistently rank near the top in fertility rates. These regions often reflect cultural expectations that encourage:
- Earlier marriage
- Larger families
- Intergenerational living
In contrast, more urbanized states tend to see lower birth rates, influenced by delayed family formation and higher living costs.
According to the Centers for Disease Control and Prevention (CDC), state fertility rates range significantly, with some states exceeding 60 live births per 1,000 women aged 15–44, well above the national average.
2. Fertility ≠ Family Stability
However, high fertility doesn’t always guarantee long-term family stability.
Some states with elevated birth rates also report above-average divorce rates, raising questions about the durability of family structures in high-fertility regions.
For a breakdown of which U.S. states report the highest divorce rates, check here.
3. The Role of Youthful Populations

States with a higher proportion of young women in their population often report higher fertility. A younger median age naturally extends the childbearing window and allows for earlier and often more frequent births.
This age-related factor boosts long-term fertility potential when paired with supportive social and economic environments.
4. Shifting Patterns in Childbearing Age
Recent national birth data reveal a changing dynamic in the age of motherhood. While birth rates among younger women are declining, rates among women in their 30s and 40s are rising.
This reflects broader societal shifts, including delayed marriage, longer educational paths, and career prioritization, reshaping fertility timelines across the country.
5. Economic Pressures on Family Growth
Key economic variables like housing affordability, childcare availability, and income stability significantly influence family planning.
National trends show that birth rates remain near historic lows, shaped by decades of changing reproductive timing and increasing financial uncertainty.
Despite recent minor increases in total births, the U.S. still falls below the replacement level (about 2.1 children per woman) needed to sustain population size without immigration.
6. Why Some States Defy National Trends
Certain rural or less densely populated states buck the national pattern thanks to:
- Lower cost of living
- Stronger local communities
- Robust family networks
These environments reduce the logistical and financial burdens of parenting, creating conditions where families may choose to have children earlier or more frequently.
7. Looking Ahead: Fertility Incentives and Future Growth
In states already posting strong fertility numbers, policy incentives such as child tax credits or savings programs like Trump Accounts could further support family formation.
When aligned with supportive community norms, these efforts may help boost or maintain population growth over the coming decade.
Methodology
Data comparisons relied on multiple national demographic studies released in 2025. World Population Review supplied birth rates per 1,000 women ages 15 to 50.
SmartAsset contributed fertility rates for women ages 20 to 34, projected annual births, and per capita birth figures.
Selection criteria emphasized high fertility among younger women, elevated births per resident, and consistent performance across multiple indicators. States with large populations but moderate fertility were excluded to avoid distortion tied to sheer size.
Evaluation prioritized reproductive behavior patterns rather than total birth volume, allowing smaller states with strong family formation trends to rank competitively.
Summary
Eight states highlighted above demonstrate strong per capita fertility performance in 2025.
Birth rates measured against population size provide clearer insight into long-term demographic momentum.
Patterns observed across these states support planning efforts tied to education infrastructure, healthcare capacity, and workforce development.
Continued incentives combined with existing social norms position these states as leaders in population growth through the coming decade.