Average investment portfolios by age in the United States depend on what gets counted. Some datasets cover workplace plans such as 401(k) and 403b.
Other datasets estimate combined retirement savings when multiple accounts are linked in one place.
Portfolio composition adds a separate layer, illustrating how allocations shift as individuals transition from early career years to retirement.
The sections that follow compile the latest figures available in late 2025.
Methodology
I used three sources because one dataset cannot capture every retirement account and portfolio in the United States.
- Empower provides the figures from anonymized dashboard users who link accounts. I used two Empower tables: total retirement savings by age and 401k only balances by age, both reported with averages and medians.
- Vanguard runs retirement plans for many employers, so it can report what people actually hold inside those workplace accounts.
- Fidelity Q3 2025 figures serve as benchmarks for average balances by account type: 401k, IRA, and 403b.
Total Retirement Savings By Age

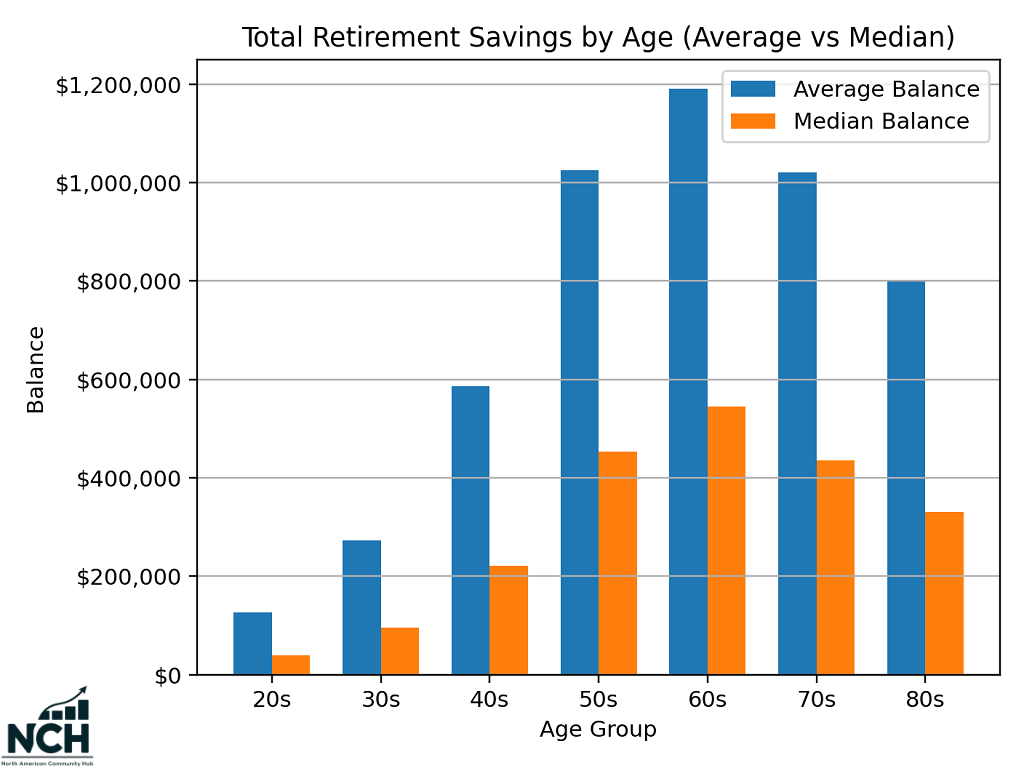
Balances look very different at 25 than at 65, so this section lines up totals by decade of life and shows both the average and the median.
The numbers rise through the 60s, then drop later, which fits the shift from saving years into drawdown years.
Latest Numbers By Decade
- 20s: average $127,166, median $39,432
- 30s: average $272,850, median $95,661
- 40s: average $586,470, median $221,819
- 50s: average $1,025,486, median $453,413
- 60s: average $1,190,078, median $544,439
- 70s: average $1,020,318, median $436,144
- 80s: average $801,103, median $331,409
Where The Growth Concentrates
The jump accelerates from the 30s into the 50s, then tops out in the 60s. After that point, both average and median move down in the 70s and 80s.
401k Balances By Age
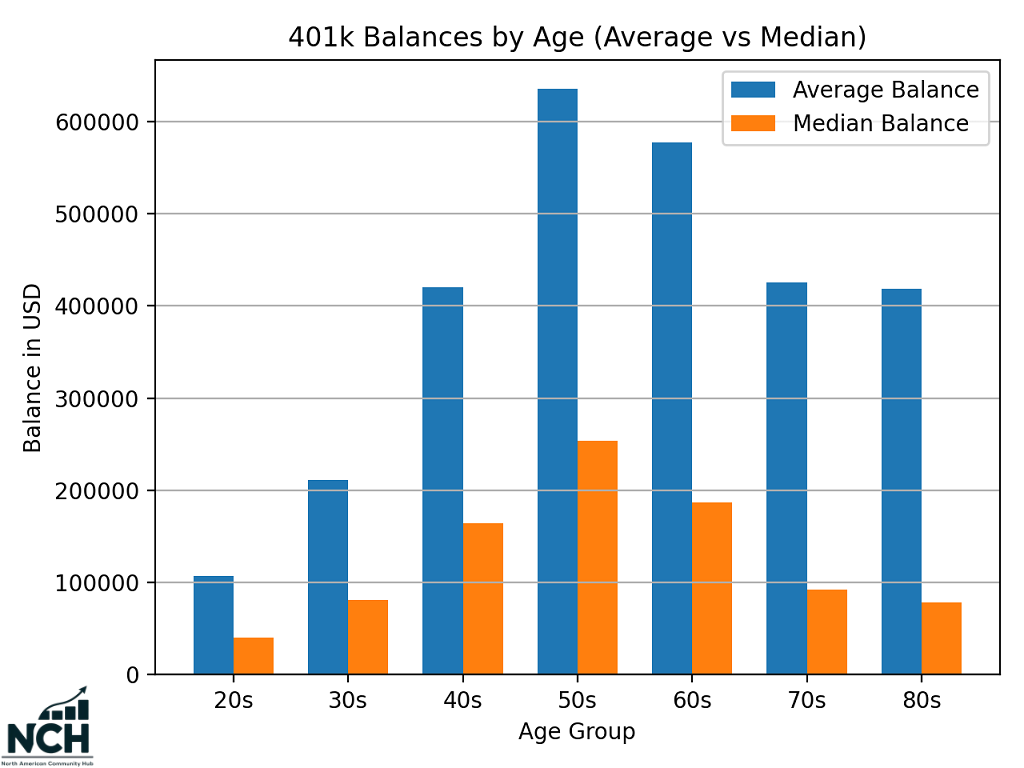
A 401k usually starts small, then grows as pay rises, contributions keep landing every paycheck, and time in the market piles up.
Later, balances often shrink because people retire, roll money into IRAs, or start taking withdrawals.
Latest Numbers By Decade
- 20s: average $107,171, median $40,050
- 30s: average $211,257, median $81,441
- 40s: average $419,948, median $164,580
- 50s: average $635,320, median $253,454
- 60s: average $577,454, median $186,902
- 70s: average $425,589, median $92,225
- 80s: average $418,911, median $78,534
What The Trend Looks Like
The typical path runs upward for decades and then bends downward. Balances roughly double from the 20s to the 30s, then double again into the 40s. The 50s show the high point.
After that, both the average and median drop, and the median falls faster. Only 4.6% of people will have $1 million or more in their retirement accounts once they retire.
Why The Peak Shows Up In The 50s
Many people still work full-time in their 50s, so contributions continue, and balances have had long enough to compound.
In the 60s and later, fewer people keep adding money, and more people start moving money out of the plan.
Why Average And Median Stay Far Apart
Median tells where the midpoint sits, and it stays well below the average at every age.
Big balances in a smaller slice of accounts lift the average, so average figures can look much richer than what most people have.
IRA and 403b Balances by Age
IRAs and 403b plans tend to show up later than 401k accounts and often hold money that has already been rolled over from earlier jobs.
Balances here look different because contributions follow different rules, and many people use these accounts as secondary or transitional buckets rather than a primary workplace plan.
What The Latest Benchmarks Show
Recent account-level benchmarks show average balances clustered in a narrow range:
- IRA: average balance around $137,900
- 403b: average balance around $131,200
These figures represent account-level averages rather than age-specific breakdowns, so they work as reference points, not decade-by-decade paths.
How IRAs Usually Build
IRAs often grow in jumps rather than steadily. Many accounts stay small for years, then jump sharply after a rollover from a 401k.
That pattern explains why averages look moderate even though some individual IRA balances become very large later in life.
Common drivers include:
- Rollovers after job changes
- Rollovers at retirement
- One-time lump sum contributions
Because of that structure, age alone explains less for IRAs than for workplace plans.
How 403b Accounts Compare To 401k Plans
403b balances track close to 401k balances on average, though participation patterns differ.
These plans appear more often in education and nonprofit jobs, where contribution rates and matching rules can vary widely.
Balances usually peak later, since many holders stay with one employer for long stretches.
Portfolio Allocation By Age: Stocks, Bonds, Cash
A headline balance can hide the part that matters most: what the money is actually invested in.
Allocation shows the split between stocks, bonds, and cash, and it makes clear whether a portfolio depends on market growth, leans on stability, or sits heavily in cash.

Average Allocation for Different Groups by Age
People in their 20s
- Cash: 33.88%
- US stocks: about 40 to 43%
- International stocks: about 8%
- Bonds: under 6% total
- Alternatives: 1.80%
People in their 30s
- Cash: 25.5% (average cash balance about $52,000)
- US stocks: about 40 to 43%
- International stocks: about 8%
- Bonds: under 6% total
- Alternatives: 2.20%
People in their 40s
- US stocks: about 40 to 43%
- International stocks: about 8%
- Bonds: under 6% total
- Alternatives: 2.57%
People in their 50s
- US stocks: about 40%
- International stocks: about 9%
- Bonds: about 8.8% total
- Alternatives: 3.04%
People in their 60s
- US stocks: about 36%
- International stocks: about 8.7%
- Bonds: about 13% total
- Alternatives: 3.48%
People in their 70s, 80s, 90s
- Cash rises sharply again: 35.1% in the 70s, 39.7% in the 80s, 45.6% in the 90s
- Bonds sit in a steady band and are split by type
- 70s: 10.61% US bonds, 1.92% international bonds
- 80s: 10.22% US bonds, 1.75% international bonds
- 90s: 8.73% US bonds, 1.21% international bonds
When it comes to alternatives, crypto, along with US Gold and Coin, are very popular trading options.
How Many People Participate In Markets?
Stock ownership in the United States runs around 60%, much of it held through retirement accounts. Crypto involvement runs close to 30%.
How Much Trading Comes From Retail

Retail traders make up a noticeable slice of daily market activity.
In 2025, estimates often land around 20 to 25%, with spikes that can reach the mid 30% range during high hype stretches.
Common patterns show up in that flow:
- Phone first brokerage apps and zero commission trading
- ETF heavy investing for quick exposure
- Short-dated options activity during headline-driven weeks
Average Versus Median: What The Gap Signals?
Average and median describe two different stories.
Average gets pulled upward by a smaller share of very large balances, while the median marks the midpoint of the distribution.
Reading both together shows how uneven retirement savings can get as age rises.
When average runs far above median, savings concentrate in a smaller share of accounts.
A few examples show the scale:
- Total retirement, 20s: average $127,166, median $39,432
- Total retirement, 60s: average $1,190,078, median $544,439
- 401k, 50s: average $635,320, median $253,454
Median stays much lower than average in every decade, and the gap widens later in life.
Bottom Line
Most people build wealth gradually, and the money often ends up spread across several accounts.
Balances usually rise for decades, peak near retirement age, then fall once withdrawals begin. Workplace plans often peak earlier because many people roll money into other accounts later in life.
Stocks tend to stay the main holding for a long time, cash stays in the mix for day-to-day flexibility, and bonds take a bigger role with age.
Average numbers can look inflated because large portfolios pull them up, so median numbers give a better sense of what is typical.
