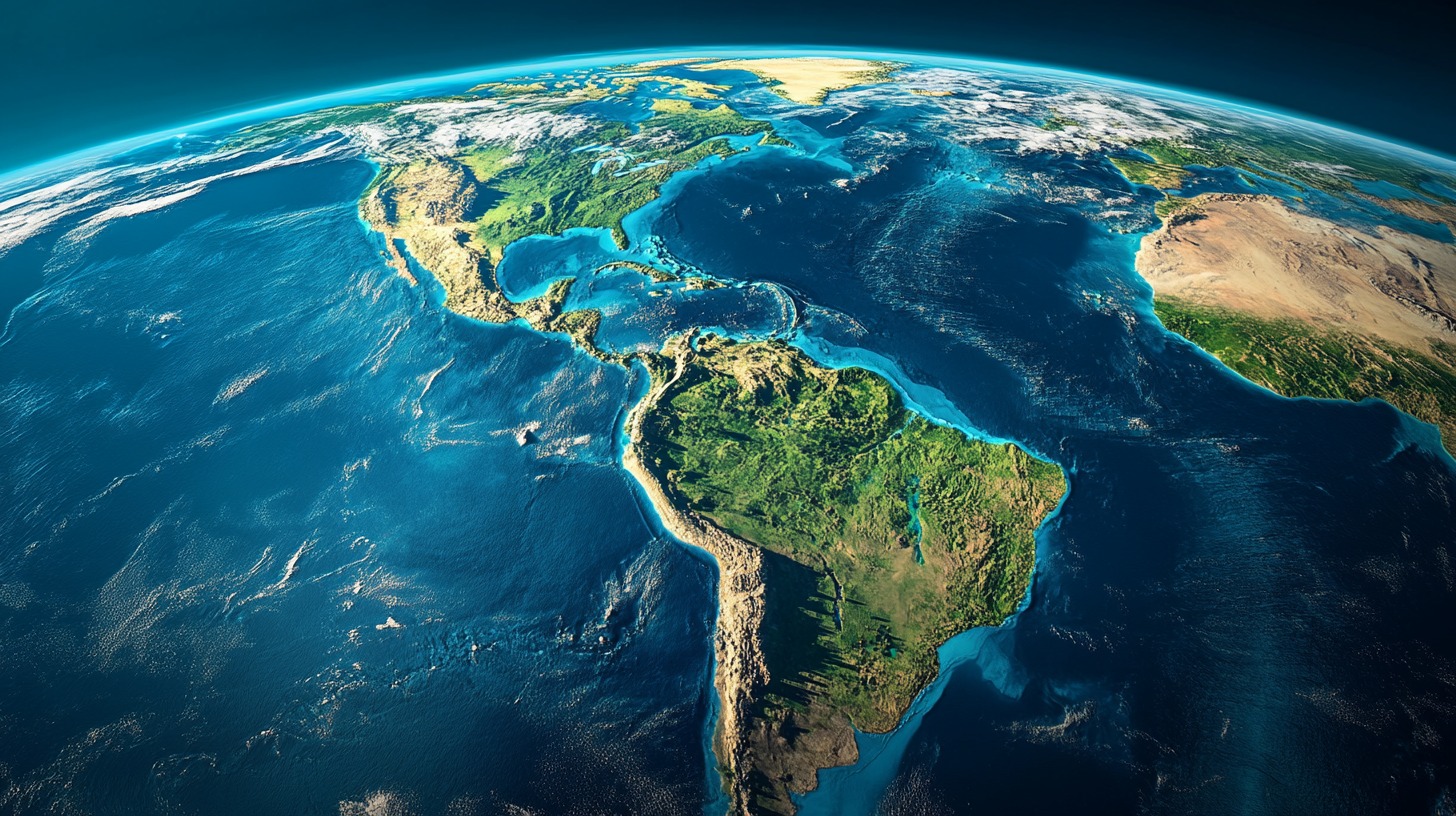
The American continent is home to over 1 billion people. They live in 23 countries in North America and 12 in South America.
But how similar are they?
At first, the contrast is huge. Everything is different when we compare the United States and Canada with Mexico and countries in South America.
First of all, the language, the northern parts of the continet speaks mostly English, followed by French(spoken in Canada). On the other hand, the central and southern parts of America speak mostly Spanish, while Portuguese is the official language in Brazil.
In terms of population, North America has around 579 million people, but a significant portion of its land remains uninhabited, especially in Canada.
South America, with 437 million people, is more densely populated in urban areas, yet its rural traditions remain strong. Economically, the divide is even sharper.
North America contributes over 25% of the world’s GDP, thanks to its technological and financial industries. South America, though rich in resources, faces economic instability and lower incomes, according to Visual Capitalist.
Key Takeaways
- North America is wealthier and more industrialized, contributing over 25% of the world’s GDP, while South America relies heavily on natural resources and agriculture.
- The U.S. and Canada have higher GDP per capita ($67,000) compared to South America ($10,010), reflecting vast economic disparities.
- Urbanization rates are high across both continents, but North America has better infrastructure, while South America faces issues like informal settlements and resource shortages.
- Trade agreements like USMCA (~$26 trillion GDP) boost North American trade, while MERCOSUR (~$2.9 trillion GDP) focuses on intra-South American economic cooperation.
- Income inequality is significantly higher in South America, where the top 10% earn 12 times more than the poorest 10%, compared to 8 times in North America.
- South America struggles with economic instability and deforestation, while North America faces challenges like wealth disparity and an aging population.
Did you know: Some of the most dangerous cities in the world are in South America. See our list of the top 9 most dangerous ones as of this year!
Population
Population size, distribution, and demographics tell a compelling story about each region.
North America and South America both boast large populations, but their numbers, density, and urbanization levels vary widely.
Comparison of Total Population
| Continent | Estimated Population (2024) | Largest Country by Population | Population Density (People per sq. km) |
| North America | ~579 million | United States (~331 million) | 22.9 |
| South America | ~437 million | Brazil (~213 million) | 24.1 |
North America as a Mix of High-Density Cities and Vast Open Spaces
- United States: Largest population in North America, highly urbanized, with around 82% living in cities according to a Homework study.
- Canada: Despite its vast size, it has a relatively small population (~38 million) concentrated near the U.S. border.
- Mexico: Rapid urban growth, with over 80% of people living in cities, particularly in Mexico City (22 million people).
South America is Known for Rapid Urbanization and Rural Traditions
- Brazil: The most populous country, home to São Paulo (22 million) and Rio de Janeiro (13 million).
- Argentina: 92% of the population lives in cities, Buenos Aires being the largest.
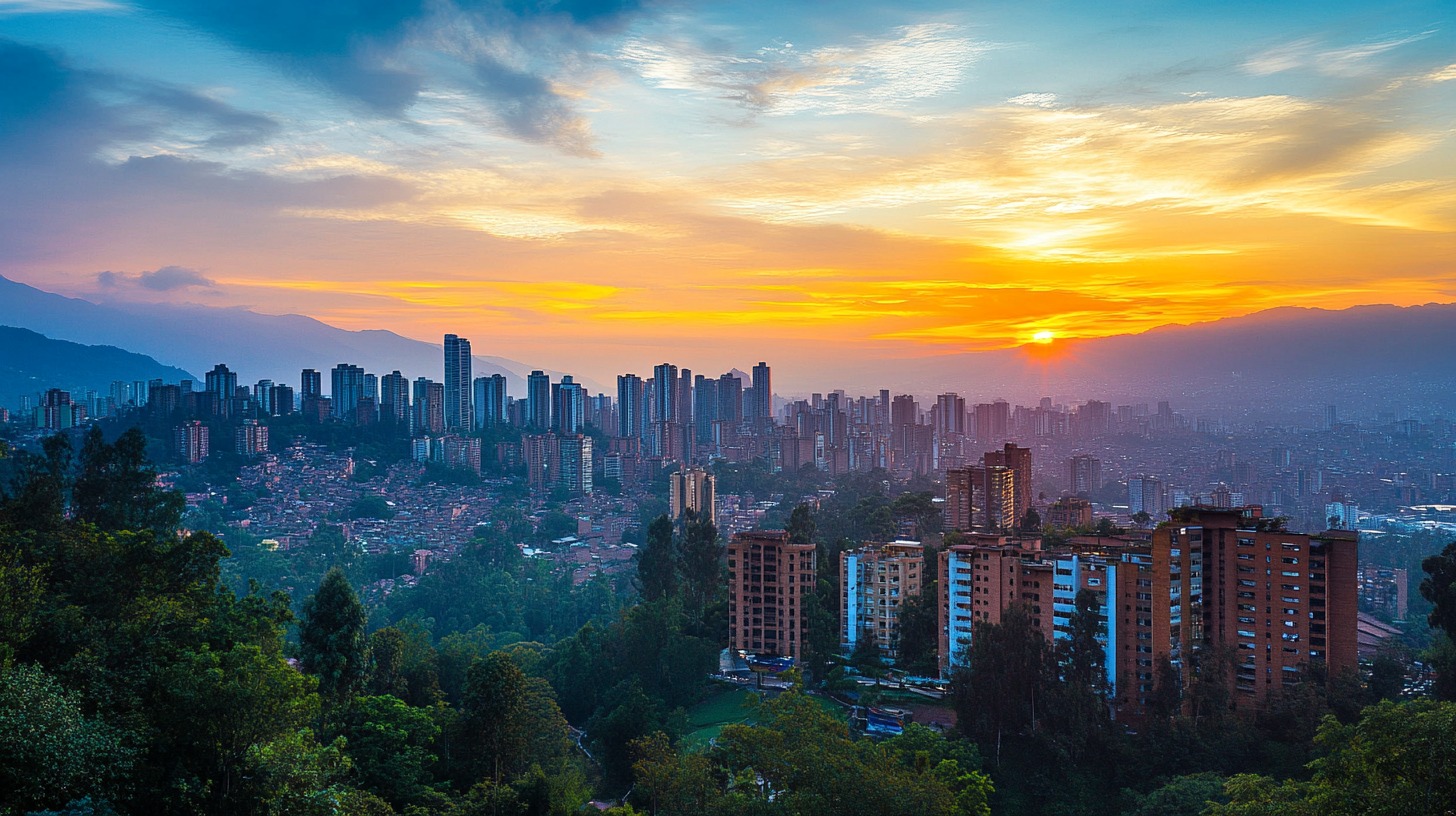
- Colombia: Nearly 80% urbanized, but rural regions still face economic hardship.
Urbanization Rate
| Country | Urbanization Rate (%) |
| United States | 82% |
| Canada | 81% |
| Mexico | 80% |
| Brazil | 87% |
| Argentina | 92% |
| Colombia | 79% |
North America – Developed Urban Centers

- United States (82%) – Major metro areas like New York (19M) and Los Angeles (13M) drive economic growth according to a World Bank report.
- Canada (81%) – The population is concentrated in cities like Toronto, Vancouver, and Montreal, leaving vast rural areas sparsely populated.
- Mexico (80%) – Rapid urban expansion, with Mexico City (22M) being one of the largest metropolitan areas globally.
South America – Rapid Urbanization & Infrastructure Gaps
- Brazil (87%) – Cities like São Paulo (22M) and Rio de Janeiro (13M) dominate, but favelas highlight inequality.
- Argentina (92%) – One of the most urbanized in Latin America, with Buenos Aires (15M) as the economic hub.
- Colombia (79%) – Urban areas like Bogotá (8M) and Medellín are growing, but rural-urban divides remain.
Key Differences
- North America has better infrastructure and planning, while South America faces overcrowding, informal settlements, and resource shortages.
- South America’s urbanization is accelerating, but income inequality and public services remain challenges.
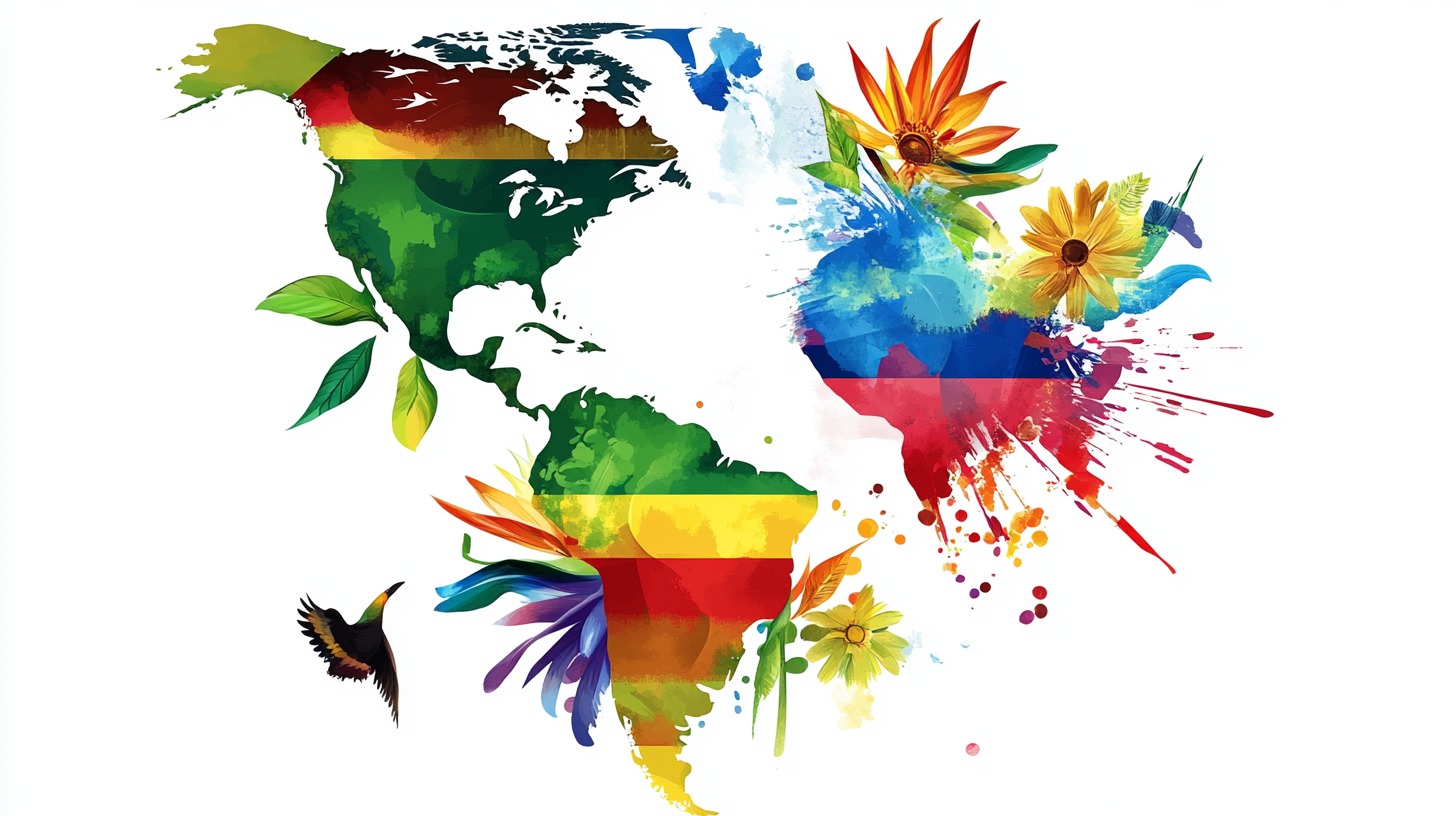
Culture – Language, Traditions, and Identity
Culture sets the two continents apart in fascinating ways. History, colonial influence, and indigenous heritage shape each region’s identity.
Language Diversity
| Continent | Main Languages | Indigenous Language Influence |
| North America | English, Spanish, French | Strong in Canada, Mexico, and the U.S. |
| South America | Spanish, Portuguese, Indigenous languages | Widespread, especially in Peru and Bolivia |
North America is dominated by English, though Spanish is rapidly growing in the U.S. South America, on the other hand, has Spanish as the primary language, except for Brazil, where Portuguese is spoken, according to the New York Times.
- Food: North America leans towards fast food and global cuisine, while South America is famous for its traditional dishes like asado (Argentina), feijoada (Brazil), and ceviche (Peru).
- Festivals: The U.S. has Thanksgiving, Canada celebrates Canada Day, while South America lights up with Carnival (Brazil) and Inti Raymi (Peru).
- Sports: Soccer dominates in South America, while North America favors American football, basketball, and baseball.
Historical Influences on Development
The divergent colonial histories of North and South America have profoundly shaped their modern trajectories.
North America
Primarily colonized by England and France, leading to the establishment of institutions that emphasized individual rights and democratic governance.
While indigenous societies like the Iroquois Confederacy had complex political systems, European colonization led to significant displacement and cultural assimilation, according to Fiveable.
The early economy was bolstered by small-scale farming, trade, and later, industrialization, setting the stage for rapid economic growth.
South America
Lumen Learning notes that language is dominated by Spanish and Portuguese colonization, which established extractive economies focused on resource extraction and plantation agriculture.
Home to advanced civilizations like the Inca Empire, which were decimated by European conquest and diseases.
Colonial rule entrenched rigid social hierarchies, with power concentrated among European elites, leading to persistent social stratification.
Economic Strength and Differences
The economies of North and South America reveal some of the starkest contrasts between the two regions.
GDP Comparison
| Continent | Total GDP (2023) | Largest Economy | GDP per Capita |
| North America | ~$27 trillion | United States (~$21 trillion) | ~$65,000 |
| South America | ~$4.3 trillion | Brazil (~$2.05 trillion) | ~$9,600 |
The economic landscapes of North and South America show stark contrasts, with North America significantly outperforming South America in terms of total GDP and GDP per capita.
According to data from the World Bank, North America’s total GDP in 2023 was estimated at $29.87 trillion, with the United States contributing approximately $26.85 trillion, making it the largest economy on the continent.
This economic dominance is reflected in GDP per capita, which stands at around $67,000, indicating a high standard of living and strong economic productivity. South America, by comparison, operates on a much smaller economic scale.
The IMF estimates that the region’s total GDP in 2023 was approximately $4.38 trillion, which is significantly lower than North America’s total output.
Brazil remains the economic powerhouse of the continent, contributing about $2.05 trillion to South America’s total GDP. Despite this, GDP per capita remains considerably lower than that of North America, with an average of $10,010, highlighting lower income levels and economic disparity within the region.
The vast difference in economic productivity between the two continents stems from several factors, including industrialization levels, technological advancement, and economic policies.
A strong service sector, technological innovation, and a well-developed financial industry drive north America’s economy.
In contrast, South America’s economy relies heavily on natural resources, agriculture, and commodity exports, making it more vulnerable to global price fluctuations and economic instability, according to CEPAL.
The disparity in GDP per capita also reflects broader income inequality, with North Americans generally enjoying higher wages, better infrastructure, and greater economic opportunities compared to many South American countries.
Key Economic Sectors
- Dominated by finance, technology, and manufacturing.
- The U.S. is home to Silicon Valley, the world’s leading tech hub.
- Canada benefits from natural resources, particularly oil and minerals.
South America:
- Strong in agriculture, mining, and energy.
- Brazil is the world’s leading producer of coffee and soybeans.
- Chile supplies over 28% of the world’s copper.
Major Trade Agreements:
| Trade Agreement | Countries Involved | GDP Covered |
| USMCA (United States-Mexico-Canada Agreement) | U.S., Canada, Mexico | ~$26 trillion |
| MERCOSUR (Southern Common Market) | Brazil, Argentina, Paraguay, Uruguay | ~$2.9 trillion |
USMCA, which replaced the North American Free Trade Agreement (NAFTA), includes the United States, Canada, and Mexico.
Collectively, these nations account for approximately 17% of global GDP, as noted by weforum.org. In 2022, trade in goods and services among USMCA countries totaled an estimated $1.8 trillion, with U.S. exports at $789.7 billion and imports at $974.3 billion, according to ustr.gov.
CFR notes that MERCOSUR comprises Brazil, Argentina, Paraguay, and Uruguay. As of 2023, the combined GDP of these founding members was nearly $3 trillion, positioning MERCOSUR as one of the world’s largest economic blocs. The bloc aims to promote free trade and fluid movement of goods, people, and currency among member states.
While North America, under USMCA, thrives on high-tech industries and financial markets, South America’s MERCOSUR focuses more on the trade of raw materials and agricultural products.
Income Inequality

Income inequality is a critical issue in both regions, though more pronounced in South America.
In countries like the United States and Canada, the top 10% of earners hold a substantial portion of the wealth.
However, social safety nets and progressive taxation systems help mitigate extreme disparities, according to iadb.org.
The region is considered the world’s most unequal.
The top 10% of earners make, on average, 12 times more than the poorest 10%.
In countries such as Colombia, Chile, and Uruguay, around 1% of the population controls between 37% and 40% of total wealth.
Poverty Rates
Poverty rates also differ markedly between the two regions.
- North America: Reuters notes that poverty rates are relatively lower, supported by comprehensive welfare programs. For instance, in 2023, the United States reported a poverty rate of 11.1%.
- South America: Approximately 27.3% of the population lived in poverty in 2023, with significant variations across countries. Extreme poverty affected 10.6% of the population according to cepal.org
| Metric | North America (United States) | South America (Regional Average) |
| Top 10% vs. Bottom 10% Income Ratio | 8:1 | 12:1 |
| Poverty Rate | 11.1% | 27.3% |
| Extreme Poverty Rate | 4.5% | 10.6% |
Challenges and Opportunities for Growth
Challenges
- North America:
- Income Inequality: Despite economic strength, wealth disparity is growing, particularly in the U.S.
- Aging Population: Canada and the U.S. are experiencing declining birth rates.
- South America:
- Economic Instability: Argentina and Venezuela struggle with inflation and currency crises.
- Deforestation: Brazil’s Amazon rainforest is under severe threat, impacting climate and biodiversity.
Opportunities
- North America:
- Innovation in AI, renewable energy, and biotech could drive economic expansion.
- Strengthened trade ties with Latin America could lead to growth.
- South America:
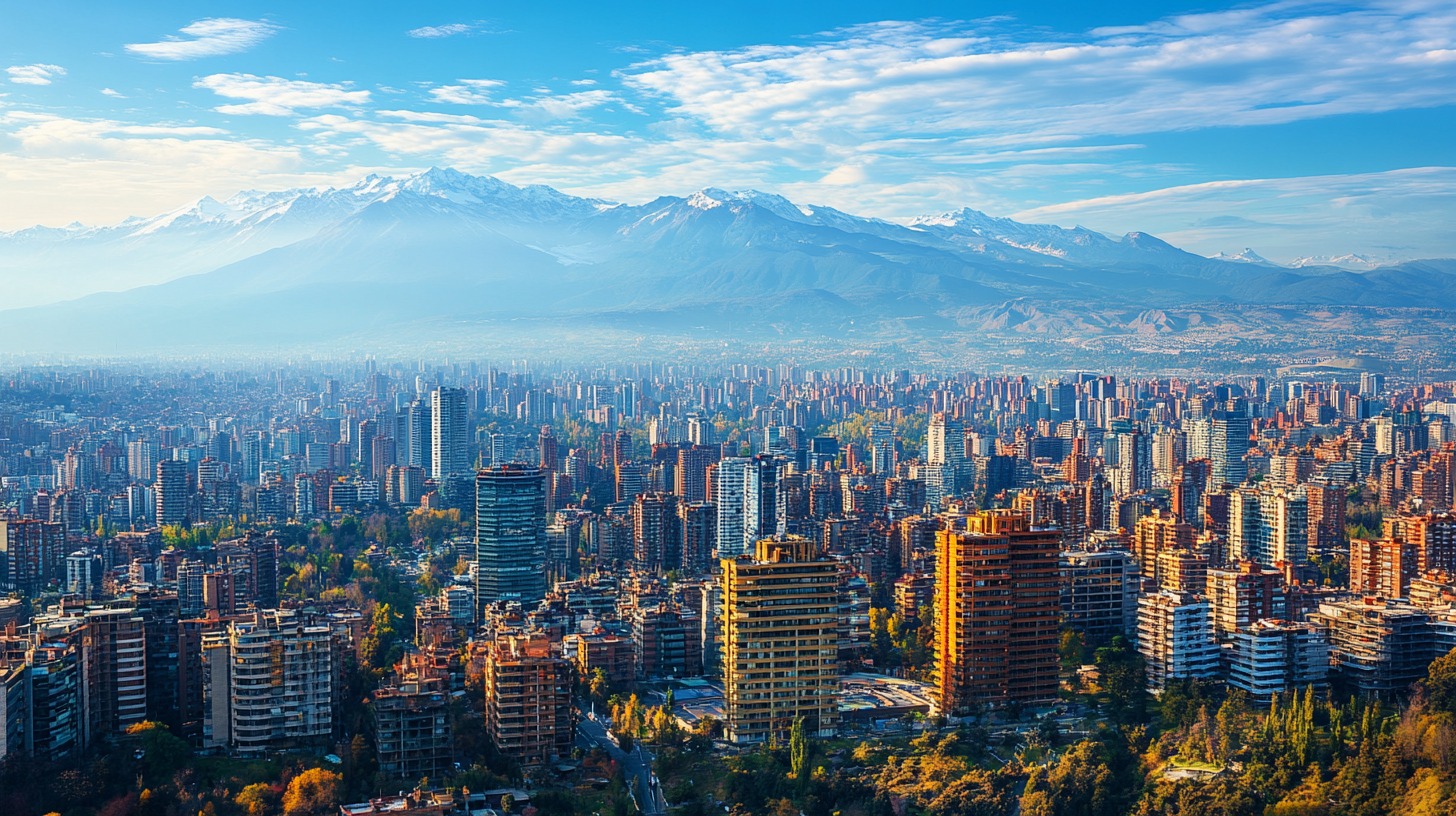
- Renewable Energy Boom: Chile leads in solar power, while Brazil invests in wind energy.
- Tourism Potential: Rich cultural heritage and natural wonders attract millions of visitors.
Conclusion
North America and South America present a study in contrast. North America dominates global trade and innovation, with infrastructure and industry that drive its high standard of living. South America shows immense cultural depth and resource wealth, yet it remains constrained by inequality, unstable economies, and political turbulence.
The differences are not limited to economics. North America reflects a model shaped by industrial expansion and technological leadership. South America reveals the legacy of extractive colonial systems, where social divides and reliance on commodities still limit growth.
Taken together, the two continents illustrate how history, policy, and global power shape opportunity. North America stands as a region of industrial and financial strength. South America continues to search for stability and development that can match its potential. The comparison highlights not only the gap between prosperity and struggle but also the unfinished work of addressing inequality across the hemisphere.