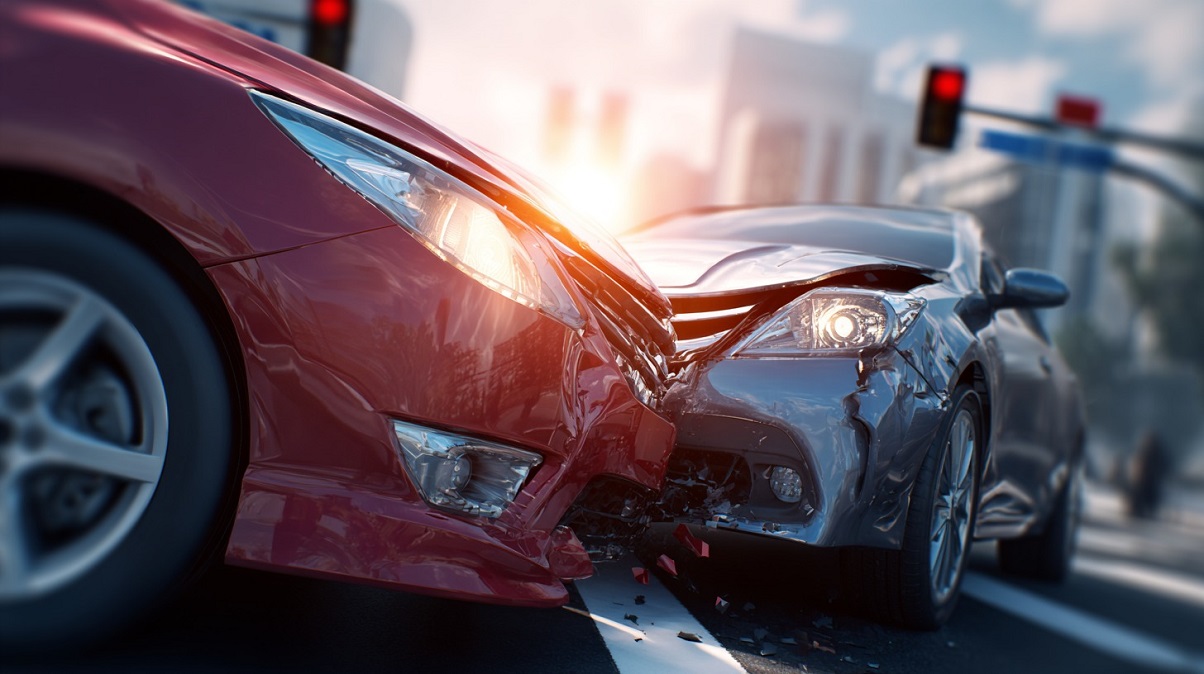
Did you know that in the first half of 2025, more than 17,000 people were killed in car accidents across the United States?
That number is slightly lower than the same stretch of 2024, but it still means hundreds of families lose someone every week because of a crash.
The national fatality rate has dropped to its lowest mid-year point in more than a decade, yet the picture changes quickly when you look at each state on its own.
Some states are recording real progress with fewer lives lost, while others are going in the opposite direction with deadly crashes on the rise. The difference often comes down to how people drive, how far they drive, and what type of roads they use every day.
This report on car accidents by state in 2025 looks at the most recent numbers, compares them with 2024, and breaks down where the risks are highest across the country.
Number of Road Accidents by State

| Rank | State | Estimated total crashes |
|---|---|---|
| 1 | Texas | 622,179 |
| 2 | California | 588,830 |
| 3 | Florida | 492,408 |
| 4 | Georgia | 234,169 |
| 5 | North Carolina | 226,339 |
| 6 | Tennessee | 191,830 |
| 7 | Arizona | 189,075 |
| 8 | Ohio | 180,085 |
| 9 | Illinois | 179,940 |
| 10 | Pennsylvania | 175,591 |
| 11 | New York | 161,526 |
| 12 | Michigan | 158,626 |
| 13 | South Carolina | 151,811 |
| 14 | Missouri | 143,691 |
| 15 | Alabama | 141,226 |
| 16 | Virginia | 132,382 |
| 17 | Indiana | 130,207 |
| 18 | Kentucky | 118,027 |
| 19 | Louisiana | 117,592 |
| 20 | Washington | 117,447 |
| 21 | Mississippi | 106,137 |
| 22 | Colorado | 104,397 |
| 23 | Oklahoma | 104,107 |
| 24 | Maryland | 90,043 |
| 25 | New Jersey | 87,868 |
| 26 | Arkansas | 86,418 |
| 27 | Oregon | 85,113 |
| 28 | Wisconsin | 84,533 |
| 29 | New Mexico | 63,363 |
| 30 | Minnesota | 59,304 |
| 31 | Nevada | 56,404 |
| 32 | Kansas | 56,114 |
| 33 | Iowa | 54,664 |
| 34 | Massachusetts | 49,734 |
| 35 | Connecticut | 44,659 |
| 36 | Utah | 40,599 |
| 37 | Idaho | 39,874 |
| 38 | West Virginia | 37,699 |
| 39 | Nebraska | 32,914 |
| 40 | Montana | 30,159 |
| 41 | Wyoming | 20,879 |
| 42 | South Dakota | 20,299 |
| 43 | Delaware | 19,575 |
| 44 | Maine | 19,575 |
| 45 | New Hampshire | 18,850 |
| 46 | North Dakota | 15,370 |
| 47 | Hawaii | 13,485 |
| 48 | Rhode Island | 10,295 |
| 49 | Vermont | 10,005 |
| 50 | Alaska | 8,700 |
Note: Totals above are estimates for 2025 derived from state DOT crash facts and adjusted by recent reporting trends. Official counts are pending release. Each state publishes verified crash totals on different schedules, and this table will be updated as the final 2025 numbers are made available.
Top 10 States With the Most Car Accidents
Car crashes remain one of the most consistent threats on American roads, but the burden is not shared evenly. Some states see far more crashes than others because of population size, urban congestion, and miles driven.
What complicates the picture is that official numbers take time to arrive. Even the full 2024 totals are not yet consolidated, since each state Department of Transportation collects and publishes its crash reports on its own timeline.

The delay means we rely on the latest verified releases, combined with state-level projections, to understand where drivers face the greatest risk today.
1. Texas
According to the Texas Department of Transportation, more than 560,000 crashes took place in 2023. That translates to one crash nearly every minute of the day.
Harris County, which covers Houston, saw the highest concentration, followed by Dallas County.
Long stretches of rural interstates, carrying heavy freight traffic, add thousands of collisions each year and make Texas the state with the highest crash count.
2. California
California’s most recent consolidated statewide crash facts, published through the California Highway Patrol SWITRS system, recorded over 216,000 crashes in 2022.
Analysts point out that this number undercounts property damage-only incidents, which push the true annual total far higher.
3. Florida
The Florida Department of Highway Safety and Motor Vehicles reported 395,000 crashes in 2023, with nearly 250,000 of them resulting in injuries.
Miami-Dade County alone contributed more than 60,000 of those incidents. Officials highlight Orlando and Tampa as additional hotspots, where tourism and rapid growth combine to keep crash numbers high year after year.
4. Georgia
State data from the Georgia Department of Transportation shows 387,000 crashes in 2022. The Atlanta metro region carries the largest share, where congestion and distracted driving dominate crash reports.
Outside the city, interstates like I-75 and I-85 drive totals upward due to high-speed traffic volumes. Georgia remains one of the most crash-prone states in the Southeast.
5. North Carolina
North Carolina Division of Motor Vehicles confirmed 276,000 crashes in 2023. Nearly 70,000 of those were injury crashes, according to the DMV crash facts summary.
The fastest-growing regions, including Charlotte and Raleigh-Durham, account for more than one-third of the state total. Highway expansion projects continue to struggle to keep up with population growth, which adds to the pressure on the roads.
6. Tennessee
Reports from the Tennessee Department of Safety and Homeland Security listed 205,000 crashes in 2022, including more than 1,300 fatal crashes.
Memphis and Nashville remain the top contributors, with the I-40 corridor singled out as one of the most dangerous stretches of roadway in the state.
7. Arizona
The Arizona Department of Transportation documented 121,000 crashes in 2022, a number that climbs every year with Phoenix’s population growth. Over 60 percent of the state’s crashes occur in the Phoenix metro area.
ADOT data links many incidents to distracted driving and long commute patterns. Projections for 2025 suggest totals closer to 190,000 once new reports are released.
8. Ohio
According to the Ohio Department of Public Safety, more than 260,000 crashes occurred in 2022. Franklin County, home to Columbus, reported the most, followed by Cuyahoga County (Cleveland) and Hamilton County (Cincinnati).
In Ohio, traffic collisions remain a constant part of daily life, especially in the busy corridors around Columbus, Cleveland, and Cincinnati, where congestion and long commutes drive the numbers up.
9. Illinois
Illinois Department of Transportation recorded 299,000 crashes in 2023, making it one of the states with the highest crash totals in the Midwest. Cook County, including Chicago, represented more than half of all incidents.
10. Pennsylvania
The Pennsylvania Department of Transportation documented 110,000 crashes in 2023, with nearly 70,000 resulting in injuries. Philadelphia and Allegheny County alone accounted for more than one-third of the total.
Even though Pennsylvania has fewer people than Texas or California, the busy roads in cities like Philadelphia and Pittsburgh mean the state still sees some of the highest car crash numbers in the Northeast.
Fatal Car Accidents by State
(Deaths caused by traffic incidents by state. Latest verified full year. Source IIHS analysis of FARS.)
| Rank | State | Fatalities |
|---|---|---|
| 1 | Texas | 4,291 |
| 2 | California | 4,061 |
| 3 | Florida | 3,396 |
| 4 | Georgia | 1,615 |
| 5 | North Carolina | 1,561 |
| 6 | Tennessee | 1,323 |
| 7 | Arizona | 1,304 |
| 8 | Ohio | 1,242 |
| 9 | Illinois | 1,241 |
| 10 | Pennsylvania | 1,211 |
| 11 | New York | 1,114 |
| 12 | Michigan | 1,094 |
| 13 | South Carolina | 1,047 |
| 14 | Missouri | 991 |
| 15 | Alabama | 974 |
| 16 | Virginia | 913 |
| 17 | Indiana | 898 |
| 18 | Washington | 810 |
| 19 | Louisiana | 811 |
| 20 | Kentucky | 814 |
| 21 | Colorado | 720 |
| 22 | Mississippi | 732 |
| 23 | Oklahoma | 718 |
| 24 | Maryland | 621 |
| 25 | New Jersey | 606 |
| 26 | Wisconsin | 583 |
| 27 | Oregon | 587 |
| 28 | Minnesota | 409 |
| 29 | New Mexico | 437 |
| 30 | Massachusetts | 343 |
| 31 | Iowa | 377 |
| 32 | Nevada | 389 |
| 33 | Kansas | 387 |
| 34 | Connecticut | 308 |
| 35 | Utah | 280 |
| 36 | Idaho | 275 |
| 37 | West Virginia | 260 |
| 38 | Nebraska | 227 |
| 39 | Montana | 208 |
| 40 | Wyoming | 144 |
| 41 | South Dakota | 140 |
| 42 | Delaware | 135 |
| 43 | Maine | 135 |
| 44 | New Hampshire | 130 |
| 45 | North Dakota | 106 |
| 46 | Hawaii | 93 |
| 47 | Rhode Island | 71 |
| 48 | Vermont | 69 |
| 49 | Alaska | 60 |
| 50 | District of Columbia | 44 |
Texas, California, and Florida dominate the list of fatal car accidents by state. Each of them reports thousands of deaths per year.
Congested urban areas, rural highways, and high traffic volumes all play a role. Georgia and North Carolina also rank high, with state records showing steady increases in car accident deaths linked to population growth and high speeds on rural interstates.
States like Tennessee, Arizona, and Ohio each record more than a thousand fatal crashes annually. Illinois and Pennsylvania close out the top ten with totals that reflect dense metro areas like Chicago and Philadelphia.
At the other end of the spectrum, Vermont, Alaska, and the District of Columbia show the lowest counts. Smaller populations and shorter highway networks mean fewer fatal car accidents, though the chance of dying in a car crash is still present everywhere.
Highest Death Rate in Traffic Accidents by Capita
Top 5 States by Fatality Rate (deaths per 100,000 People)
- Mississippi – 25.4
- Arkansas – 22.9
- South Carolina – 22.5
- New Mexico – 21.7
- Montana – 21.6
Lowest 5 States by Fatality Rate (deaths per 100,000 People)
- Massachusetts – 4.9
- Rhode Island – 5.2
- New Jersey – 6.2
- New York – 6.3
- Hawaii – 6.4
Drivers in Mississippi face the highest chance of dying in a car crash, more than five times the risk faced by drivers in Massachusetts.
States with wide rural highways, longer travel distances, and limited trauma care tend to have the highest per-capita death rates. States in the Northeast and along the coasts show lower risk, helped by urban density, shorter trips, and stricter enforcement.
Looking at fatal car accidents by state in this way shifts the focus from raw totals to actual risk, reminding us that location shapes the danger as much as traffic volume.
Fatalities by Vehicle Type

The kind of vehicle on the road often determines how severe an accident can become. Light trucks, cars, motorcycles, and even specific models show very different patterns in national crash data.
| Vehicle type | Number involved (in thousands) | Share of total crashes |
|---|---|---|
| Light trucks (SUVs, pickups) | 4,548.9 | 43.2% |
| Passenger cars | 4,015.8 | 38.1% |
| Large trucks | 536.4 | 5.1% |
| Motorcycles | 102.7 | 1.0% |
| Buses | 53.2 | 0.5% |
| Other/unknown | 1,271.8 | 12.1% |
(Source: Statista)
Light trucks accounted for the largest share, with more than 4.5 million crashes, followed closely by passenger cars at just over four million.
Motorcycles made up only a small fraction of crashes overall, but riders continue to face the highest fatality rates per mile traveled.
Most Accident-Prone Vehicles by Model
Some makes and models appear far more often in crash data than others. Researchers compared crash counts between 2016 and 2020 with 2021 sales figures to reveal which cars were statistically most accident-prone.
- Ford Fusion – 1,931 crashes vs. 11,781 sales (16.39% crash rate)
- Nissan Maxima – 1,147 crashes vs. 16,386 sales (7.00% crash rate)
- Ford Mustang – 1,925 crashes vs. 52,384 sales (3.67% crash rate)
- Honda Accord – Highest crash count across 18 states, more than 2,600 crashes per 100,000 sold cars
- Nissan Altima – Nearly 1,900 crashes per 100,000 sold cars
- Chevrolet Silverado – Over 1,500 crashes per 100,000 sold cars, most frequently involved pickup in 14 states
Why Certain Cars Appear More Often in Fatal Crashes
Several factors explain why some vehicles dominate fatal car accident data:
- Vehicle design flaws such as poor visibility, weak braking response, or limited safety features.
- High horsepower-to-weight ratios that encourage speeding and risky driving.
- Driver demographics, since younger or more aggressive drivers often favor sports cars like the Mustang or Maxima.
- Sales volume, which ensures popular models like the Accord or Altima will appear more often in crash statistics.
Time of Day and Day of Week Patterns
- Saturday has the most fatal crashes in the week
- Friday evenings show a sharp spike in deaths
- 4 p.m. to 7:59 p.m. is the most dangerous daily period
- Summer sees the deadliest late-night crashes (8 p.m. to midnight)
- Winter brings higher fatal crashes in the early evening
The clock and the calendar shape crash risk in ways that cannot be ignored.
Data from the National Safety Council shows that fatal car accidents peak when the roads are busiest, and when risky behaviors like drinking or speeding are most likely.
Saturdays consistently record the highest number of deadly crashes, followed by Sundays, while nonfatal crashes often stack up on Fridays as people rush into the weekend.
Evenings carry the most danger. Between 4 p.m. and 7:59 p.m., fatal crashes rise sharply, and in the summer months, the peak shifts later into the night. In winter, the most dangerous stretch falls back into the early evening as darkness arrives sooner.
Nonfatal crashes, by contrast, tend to peak earlier in the day, especially midday during the warmer months.
Leading Causes of Car Accidents in the United States

Research from GJEL Accident Attorneys analyzed crash records and legal cases to rank the most common factors behind car accidents in America. Their study shows that most crashes are tied to driver behavior, with a small share linked to vehicle or road conditions.
- Distracted Driving – The leading cause of crashes in the United States, ranging from cell phone use to eating or reaching for objects.
- Speeding – Higher speeds reduce reaction time and increase the severity of collisions.
- Drunk Driving – Alcohol impairment continues to take thousands of lives every year, especially at night.
- Reckless Driving – Aggressive lane changes, tailgating, and ignoring other drivers’ right of way.
- Running Red Lights – A frequent cause of deadly side-impact collisions at intersections.
- Driving in Rain – Slippery pavement and reduced visibility lead to spikes in accidents during storms.
- Tailgating – Following too closely remains one of the most common triggers of rear-end crashes.
- Drowsy Driving – Fatigue impairs judgment, slows reaction, and often leads to lane departures.
- Drug Impairment – Illegal drugs and certain prescriptions contribute to thousands of fatal crashes each year.
- Fog – Dense fog reduces visibility and often causes multi-vehicle pileups.
- Snow – Ice and heavy snow increase crash counts in northern states each winter.
- Unsafe Lane Changes – Moving between lanes without signaling or checking blind spots.
- Teenage Drivers – Inexperience combined with risk-taking behaviors leads to higher accident rates.
- Night Driving – Nearly half of fatal crashes occur at night when visibility and alertness are lower.
- Animal Crossing – Sudden movements of deer and other animals cause severe crashes, especially in rural areas.
- Construction Zones – Confusing signage and sudden lane shifts lead to higher crash totals.
- Improper Turns – Ignoring turn signals or making illegal maneuvers at intersections.
- Wrong-Way Driving – Often linked to impairment, leading to head-on collisions at freeway speeds.
- Vehicle Malfunctions – Mechanical failures such as brake loss or steering defects.
- Potholes – Poor road surfaces cause loss of control, blown tires, and sudden swerving.
- Tire Blowouts – A burst tire often results in rollover crashes or severe loss of control.
- Curves – Tight or blind curves, especially on rural roads, remain hotspots for accidents.
- Failure to Obey Rules of the Road – Ignoring stop signs, traffic signals, or yielding rules.
- Street Racing – Illegal high-speed competitions put both participants and bystanders at risk.
- Ice – Black ice in particular leads to unexpected skidding and serious collisions.
If you’ve been involved in a crash and want to learn more about what to do next and how to protect your legal rights, check out this guide on protecting your rights after a car accident, including how to handle insurance claims, document evidence, and seek compensation with the help of an experienced attorney.
Urban vs Rural Car Accidents
When comparing car crash patterns across the country, the split between rural and urban roads reveals where the risk is most intense.
| Urban | 54% |
| Rural | 45% |
National data shows that fatal crashes occur in both settings, with urban areas slightly ahead in overall share, but rural states often see a far greater percentage of deadly collisions relative to traffic volume.
Wide open highways, limited lighting, and long distances from trauma care raise the chance of dying in a car crash when it happens far from the city.
According to research compiled by Morris Bart Personal Injury Lawyers based on federal crash statistics, the divide becomes clear when examining states in the Deep South:
- Alabama – 58% of fatal car accidents happened in rural areas, compared with 42% in urban settings.
- Arkansas – 68% of crash deaths occurred in rural areas, only 32% in urban.
- Louisiana – The split was nearly even, with 52% rural versus 48% urban.
- Mississippi – Rural areas dominated with 70% of fatalities, leaving only 30% in cities.
Two recurring factors stand out across rural crash reports: speeding and alcohol impairment. Both remain leading contributors to fatal car accidents outside of urban centers. Poor road maintenance, sharp two-lane highways, and animal crossings also add risks that are far less common on city streets.
The picture is more balanced nationwide, with urban areas accounting for 54% of crash deaths and rural areas 45%.
But in states with large rural road networks, the fatality rate per capita is far higher outside the cities, underscoring how location shapes the danger as much as traffic volume.
Age and Gender in Car Accident Statistics
Crash data shows that age and gender shape both the frequency and severity of accidents.
Teenagers face the highest crash rates per mile driven, middle-aged drivers are most represented overall, and seniors face higher death risks after collisions.
Gender also plays a major role, with men linked to most fatal crashes and women more often involved in non-fatal accidents.
Crash Characteristics by Age Group
| Age Group | Crash Characteristics | Share of Fatal Crashes (%) |
|---|---|---|
| 16-19 | Fatal crash rate nearly 3 times higher than drivers over 20 | 8% |
| 20-34 | High involvement in impaired and speeding-related crashes | 27% |
| 35-64 | The largest share of overall crashes is due to high miles driven | 45% |
| 65+ | Lower crash counts but a higher chance of death due to frailty | 20% |
Source: CDC
Teenagers show the steepest risk per mile traveled, with inexperience, distractions, and night driving raising crash rates. Young adults in their twenties and early thirties continue to dominate impaired and speeding-related crashes.
Middle-aged drivers carry the highest exposure levels due to work and family travel. Seniors face fewer crashes overall, but their health vulnerability makes survival less likely after a serious accident.
Gender Patterns
- Men are involved in about 70% of fatal crashes nationwide.
- Men are nearly three times more likely than women to be arrested for DUI.
- Women show a 26% higher rate of non-fatal injury crashes, often leaving them more likely to be hurt even when the crash is not deadly.
- Men dominate motorcycle fatalities, while women face higher odds of injury in passenger cars.
Pedestrian and Cyclist Fatalities in the United States

Pedestrian deaths remain one of the most troubling aspects of traffic safety. According to the Governors Highway Safety Association (GHSA), drivers struck and killed 7,148 people walking in the United States in 2024.
That represents a decline of about 4 percent from the prior year, but still leaves totals nearly 20 percent higher than 2016 levels. In fact, pedestrian deaths hit a 40-year high in 2022 before beginning their modest decline.
Cyclists also remain at risk. Federal and state crash databases show more than 1,000 bicyclist deaths annually, a number that has stayed relatively steady but is now increasingly concentrated in urban areas. Together, pedestrians and cyclists account for about one in five traffic deaths nationwide. For a deeper look specifically at collisions between cars and bicycles, how often they occur, trends over time, causes, and risk factors for cyclists, find reliable car vs bicycle accident statistics.
- Hit-and-runs: About 25% of pedestrian deaths involve drivers who flee.
- Vehicle type: SUVs and pickups were involved in 54% of fatal pedestrian crashes where the vehicle type was known in 2023.
- Nighttime is more dangerous: Over three-quarters of pedestrian fatalities happen after dark, with an 84% rise in nighttime deaths since 2010.
- Road design: Nearly two-thirds of pedestrian deaths occur in areas with no sidewalks.
- Cyclists: The majority of bicyclist fatalities occur in large metropolitan areas, often at intersections with heavy traffic.
How Vehicle Technology and Safety Features Reduce Car Accident Deaths
Car accident deaths in the United States have gone down in the past decade, and much of that drop is tied to improvements in vehicle safety.
Herrman & Herrman P.L.L.C. reported that fatalities fell by about 3% in a single year and nearly 25% over the past ten years, based on federal crash records.
The message is clear: new technology and better safety design lower the chance of dying in a car crash.
Seatbelts still remain the most important factor in survival.
In 2013, almost half of the people who died in crashes were not buckled up. Motorcycle helmet laws also show the same effect.
States that require helmets had far fewer deaths compared to states that do not.
Data confirms that basic protections, when combined with advanced technology, give drivers and passengers the best chance of avoiding fatal injury.
Most vehicles today are equipped with features that directly reduce the risk of a fatal car accident:
- Airbags that adjust to the type of impact, protecting both drivers and passengers.
- Lane departure alerts that help prevent drifting into another lane.
- Blind spot monitoring to cut down on side collisions.
- Back-up cameras and sensors give a clear view when reversing.
- Run-flat tires that reduce the danger of blowouts.
- Adaptive headlights that adjust on curves for better visibility.
- Emergency assistance systems like OnStar that call for help after a crash.
Experts stress that while these safety features save lives, they do not replace safe driving. Relying too much on technology can be dangerous. Distraction, speeding, and impaired driving still cause thousands of car crash deaths each year.
Technology works best when drivers stay alert and use it as support, not as a substitute for paying attention.
How State Laws Shape Car Crash Fatality Rates
Research published in the Journal of Trauma and Acute Care Surgery in 2020 examined how driver-related state laws affected crash deaths between 1999 and 2015.
The study analyzed more than 850 state-year data points and revealed that not all laws carry the same weight in reducing fatalities.
Some laws have had a clear impact across age groups, while others have made little difference.
Key Findings from the Study
- Lower Blood Alcohol Content (BAC) Limits: States that reduced the legal BAC from 0.10 to 0.08 saw the largest declines in crash deaths and the number of car accidents overall. The effect was strongest among older drivers, with fatality reductions up to 400 percent in those over 65.
- Per Se BAC Laws: Automatically defining intoxication at or above the legal BAC limit further lowered deaths, especially for middle-aged and older groups.
- Red Light Cameras: These laws contributed to noticeable declines in fatalities, particularly for drivers aged 56-65. Speed cameras, by contrast, showed no measurable effect.
- Seatbelt Laws: Stronger enforcement laws (primary seatbelt use in all seats) were tied to declines across most age groups, with the largest drop of 24 percent among drivers aged 21-55.
- Graduated Driver Licensing (GDL): Among teens 16-20, GDL laws reduced deaths by about 6 percent, mainly through passenger restrictions and longer learner permit periods.
- Marijuana Decriminalization: States that legalized or decriminalized marijuana saw an increase in crash deaths across all age groups. Laws targeting marijuana-impaired driving did not offset the rise.
- Cellphone and Texting Bans: Broad handheld bans helped reduce fatalities for the youngest and oldest groups. However, texting bans alone did not show consistent results.
The study makes one point clear: fewer, well-targeted laws save more lives than piling on extra rules with weak enforcement.
Lower BAC standards, seatbelt enforcement, and red-light cameras have worked. In contrast, enhancements like mandatory alcohol education or interlock devices showed little evidence of changing death rates at the population level.
Frequently Asked Questions
Which State Has the Safest Drivers Overall?
Massachusetts is often cited as the safest state for drivers, with the lowest fatal crash rate in the nation at fewer than 5 deaths per 100,000 people. Dense urban areas, strong enforcement, and shorter driving distances help keep the rate low.
Why Does Mississippi Lead in Fatal Car Accident Rates Year After Year?
Mississippi reports the highest per capita fatal crash rate in the country. Wide rural highways, higher average speeds, limited trauma care access, and a high share of alcohol-related crashes all contribute to its ranking.
Do Ridesharing Apps Reduce Car Crash Deaths?
Yes. studies in large urban centers show that Uber and Lyft have been linked to measurable declines in car accidents. The effect is most visible in cities where late-night ridesharing is widely available.
How Has Marijuana Legalization Affected Road Safety?
States that have decriminalized or legalized marijuana saw an increase in crash deaths across age groups. The rise is especially pronounced in younger drivers. Enforcement of marijuana impairment laws has not kept pace with the changes.
Do Speed Cameras and Red-Light Cameras Actually Save Lives?
Red-light cameras have been linked with fewer fatal crashes, especially in urban intersections. Speed cameras, however, show little measurable effect on crash deaths in the United States.
Which Age Group Has the Most Fatal Car Accidents?
Drivers aged 35 to 64 are involved in the largest share of fatal car accidents, about 45 percent of the total, mainly because of the sheer number of miles they drive. Teenagers face the highest risk per mile, and older adults are more likely to die when they crash.
What Role Do Helmets and Seatbelts Play in Surviving a Car Accident?
Half of all people killed in crashes were not wearing seatbelts. In states with universal motorcycle helmet laws, fatalities dropped dramatically. These two protections remain the strongest single factors in preventing death.
Final Thoughts
The numbers tell a complicated story. Fatalities have declined in some states thanks to stronger laws, safer cars, and improved enforcement, yet the toll remains high nationwide. Rural regions continue to face greater risk, men dominate fatal crash data, and teenagers still pay a steep price for inexperience.
The bottom line is that traffic deaths are not random. They reflect choices, conditions, and policies that can be changed. The data shows where progress is possible and where the country still falls short. The challenge ahead is turning the evidence into action that saves lives on the road.
Also: Check out the most popular European cars in the US in 2025