According to the most recent Annual Homelessness Assessment Report (AHAR) released by the U.S. Department of Housing and Urban Development, about 653,100 people experienced homelessness on a single night in January 2023.
The total marked a 12% jump from the prior year, with 70,650 more people counted as homeless than in 2022. Using a 2025 U.S. population estimate of about 346,163,343 from the U.S. Census Bureau, the January 2023 figure works out to roughly one homeless person for every 530 residents.
HUD described the shift as the largest year-over-year increase since nationwide tracking began in 2007. The AHAR figures come from annual Point in Time counts in January, gathered by volunteers, outreach teams, and service providers to capture a one-night snapshot that helps guide federal funding decisions.
| Rank | City | Number of Homeless People | Without Shelter(%) | With Shelter(%) | Highlights / Notes |
|---|---|---|---|---|---|
| 20 | Miami, FL | 3,800 | 27% | 73% | 261 arrests under anti-camping law; hotel-to-housing conversion in Cutler Bay |
| 19 | Dallas, TX | 3,718 | 15% | 85% | $72M investment; homelessness down 24% since 2021; 95% acceptance rate for housing |
| 18 | Long Beach, CA | 3,376 | 72.7% | 27.3% | Youth homelessness down 47%; minors down 37%; $60M city investment |
| 17 | San Antonio, TX | 3,372 | 30% | 70% | Chronic homelessness up; Towne Twin Village housing model; 98% retention |
| 16 | Fresno, CA | 4,493 | 61% | 39% | 33% chronic; 36% substance use; 33% mental health issues |
| 15 | Washington, D.C. | 4,922 | 17% | 83% | Highest per-capita rate; 30% aged 55+; 81% Black residents |
| 14 | Philadelphia, PA | 5,191 | 19% | 81% | Kensington area holds 35% of unsheltered, 727 minors in shelters |
| 13 | Boston, MA | 5,202 | 9% | 91% | Family homelessness up; total homelessness down 32% since 2015 |
| 12 | Oakland, CA | 5,490 | 67% | 33% | 9% overall increase; Homekey programs expanded housing capacity |
| 11 | Sacramento, CA | 6,615 | 60% | 40% | Total down 28.7%; strong family support programs; mental health focus |
| 10 | Chicago, IL | 6,139 | 16% | 84% | Asylum seekers now 42% of shelters; 69% Black population share |
| 9 | Portland, OR | 6,297 | 68% | 32% | 58-88% substance use; fentanyl top cause of death under 50 |
| 8 | Las Vegas, NV | 7,928 | 53% | 47% | Return-to-homelessness 28.6%; 42% Black; only 1 in 8 get housing referral |
| 7 | San Francisco, CA | 8,323 | 52% | 48% | Family homelessness up 82%; 28% LGBTQ+ share; high chronic rate |
| 6 | Phoenix, AZ | 9,435 | 45% | 55% | 83% of countywide shelter expansion; shelter capacity at record levels |
| 5 | Denver, CO | 9,977 | 35% | 65% | Family homelessness down 82%; $100 million funding; 4,300 immigrants not counted |
| 4 | San Diego, CA | 10,605 | 58% | 42% | 44% increase in vehicle homelessness; 81% first-time homeless |
| 3 | Seattle, WA | 16,000 | 61% | 39% | 23% rise since 2022; potential shelter budget cuts; rent pressure |
| 2 | Los Angeles, CA | 75,312 | 70% | 30% | 31% Black; 40% chronic; veteran homelessness down 22.9% |
| 1 | New York City, NY | 350,000+ | 38% | 62% | Highest in U.S.; 132,076 sheltered nightly; <1% affordable vacancy rate |
Numbers Are Rising While Trends Are Getting Worse
Homelessness is no longer confined to specific pockets of urban poverty but rather a widespread issue that is affecting both major metropolitan areas and suburban and rural communities.
Key national trends between 2020 and 2023 include:
- Chronic homelessness increased by nearly 30%, reaching 143,100 individuals, the highest since 2007.
- Despite increases in shelter availability following the lifting of COVID-19 restrictions, 40% of homeless individuals remained unsheltered, predominantly in urban centers.
- Veteran homelessness has decreased, and family homelessness has grown at a slower rate compared to other subpopulations.
- Major cities such as New York City and Los Angeles accounted for nearly one-quarter of the country’s entire homeless population.
1. New York City, New York
| Number of Homeless People | 350,000+ (sheltered, unsheltered, and doubled-up) |
| Population in Shelters | 132,076 people |
| New Arrivals in Shelters | 45% (65,731 individuals) |
| Children in Homeless Shelters | 119,320 school-aged children |
| Average Duration of Shelter Stay | 412 days (single adults), 437 days (families), 750 (adult families) |
| Affordable Housing Vacancy Rate | <1% |
| Demographics | 56% Black, 32% Hispanic/Latin, 7% White |
The situation is driven by skyrocketing rents, a loss of 1.1 million affordable housing units since the 1990s, and an affordable housing vacancy rate below 1%, according to NYC Comptroller data.
2. Los Angeles, California
| Number of Homeless People | 75,312 in LA County (↓ 0.3% from 2023) |
| Sheltered Population | 22,947 people |
| Unsheltered | ↓ 5.1% |
| Homeless Veterans | ↓ 22.9% |
| Homeless Families | 10,710 (↑ 2.2%) |
| Black Homeless Population | 31% (vs. 8% of county population) |
| Chronically Homeless | 40% of the total |
| Substance Use & Mental Illness | 21% and 23% respectively |
The number of visible tents and makeshift shelters also declined by 9.2%, suggesting short-term success in relocating individuals to temporary housing. Additionally, veteran homelessness dropped by nearly 23%, and transitional-age youth homelessness declined by 16.2%.

However, structural challenges persist: 31% of the county’s homeless population is Black, despite making up only 8% of the total population. More than 40% of individuals are chronically homeless, and over 37% are survivors of domestic violence.
The Metro, South LA, and San Fernando Valley regions account for the bulk of the homeless population, with Antelope Valley showing the largest regional spike at +42%. City officials, including Mayor Karen Bass, have embraced an “Inside Safe” strategy to transition encampments into housing.
Still, experts warn that affordable housing shortages, lack of mental health care, and poverty remain entrenched-and without deeper reform, short-term wins may not hold.
3. Seattle, Washington
View this post on Instagram
| Total Homeless Population | 16,000+ in King County (↑ 23% from 2022) |
| Unsheltered Homeless People | 9,810 people (↑ 27.7%) |
| Sheltered Population | 6,575 people (↑ 15.7%) |
The homelessness crisis reached its highest point ever in 2024, with over 16,000 individuals across King County reporting a 23% increase from 2022. The number of people living unsheltered surged to 9,810, while sheltered homelessness also grew significantly to 6,575, according to The Seattle Times.
Officials warn that critical shelter services may face cuts in 2025 due to budget constraints, according to the King County Regional Homelessness Authority, threatening to reverse recent progress.
The city is stuck in a tug-of-war: record investments in shelter and housing on one side, and rising rents, addiction, and displacement on the other. Mayor Bruce Harrell’s administration continues to emphasize coordination, but with more than 27% of the region’s homeless unsheltered, advocates argue the system needs a structural overhaul, not just emergency response.
4. San Diego, California
| Total Homeless Population | 10,605 (↑ 3% from 2023) |
| Unsheltered vs Sheltered | 6,110 unsheltered / 4,495 sheltered |
| Living in Vehicles | ↑ 44% increase |
| Safe Sleeping Site Residents | 472 people |
| Safe Parking Site Residents | 285 people |
| Homeless Rate in San Marcos | ↑ 1,600% (largest regional spike) |
| First-Time Homelessness | 81% of those counted |
San Diego County’s 2024 PIT count revealed 10,605 people experiencing homelessness, a 3% rise over the previous year, according to the CBS8 Report. Of these, 6,110 were unsheltered, including a sharp 44% increase in people living in their cars.
Despite creative solutions like safe parking and safe sleeping sites, which housed 757 individuals but are still classified as “unsheltered” by federal definitions.
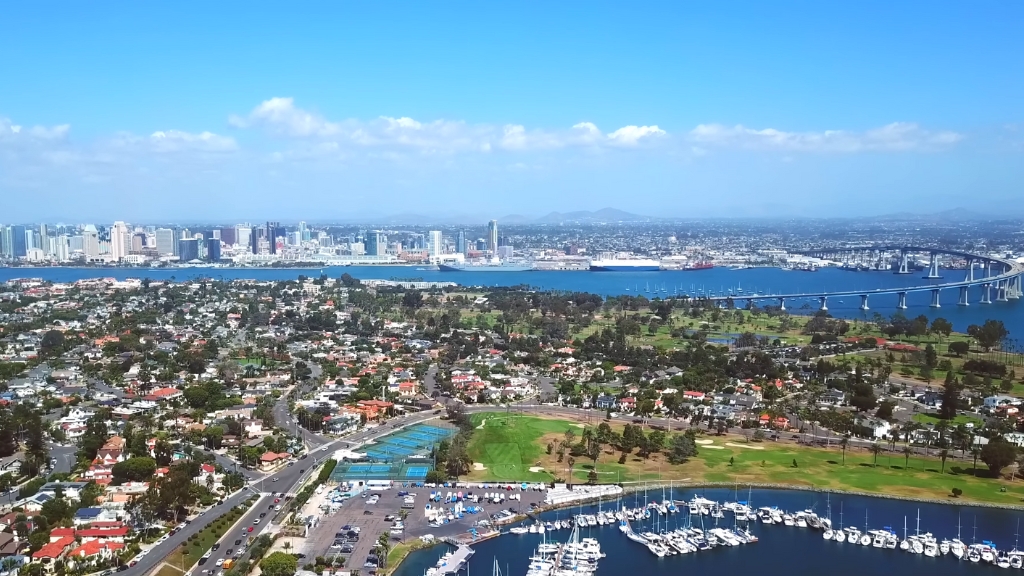
Regional disparities were stark: cities in North San Diego County experienced massive increases – Encinitas (68%), Carlsbad (86%), Vista (93%), and San Marcos exploded by over 1,600%.
Most notably, 81% of individuals counted were experiencing homelessness for the first time, highlighting the unstable economic conditions and sky-high housing costs fueling the crisis.
5. Denver, Colorado
| Total Homeless Population | 9,977 people (↑ 10% from 2023) |
| Denver Homeless Count | 6,539 (↑ 12%) |
| Unsheltered Homeless | ↓ 10.5% |
| Unsheltered Families | ↓ 82.5%, from 103 to just 18 families |
| Tent Encampments | ↓ 23%, from 242 cents to 117 |
| Funding for Shelters | Over $100 million invested |
| Excluded from PIT Count | 4,300 new immigrants in temporary shelters |
The Metro Denver Homeless Initiative’s 2024 report recorded 9,977 people experiencing homelessness, marking a 10% year-over-year increase, with Denver alone accounting for 6,539 individuals – up 12% from the prior year.
That said, the city also made measurable progress: unsheltered homelessness dropped by 10.5%, and family homelessness on the streets plummeted by 82.5%. The number of tent encampments decreased by 23%, supported by over $100 million invested into non-congregate shelters and micro-community models.
Mayor Mike Johnston has made tackling homelessness a key campaign promise, launching initiatives that prioritize “housing-first” and rapid sheltering models.
However, 4,300 newly arrived immigrants – many staying in temporary shelters – were not included in the official PIT tally, hinting that the actual need is even higher, according to Denverite.
While critics say the city still has work to do, few metro areas have matched Denver’s speed in reducing visible homelessness, particularly among families.
6. Phoenix, Arizona
| Total Homeless Population | 9,435 people (↓ slightly from 9,642 in 2023) |
| New Shelter Beds | Phoenix added 83% of new shelter capacity in Maricopa County |
| St. Vincent de Paul Shelter | Houses ~320 people per night |
Despite this, the scale of the crisis remains significant, especially in Phoenix, where the city has added 83% of all new shelter beds countywide since the pandemic began, according to the Maricopa County PIT Report.
Sheltered homelessness increased due to expanded resources, while unsheltered numbers declined, in part due to heavy rainfall during the 2024 PIT count, which likely brought more people indoors.
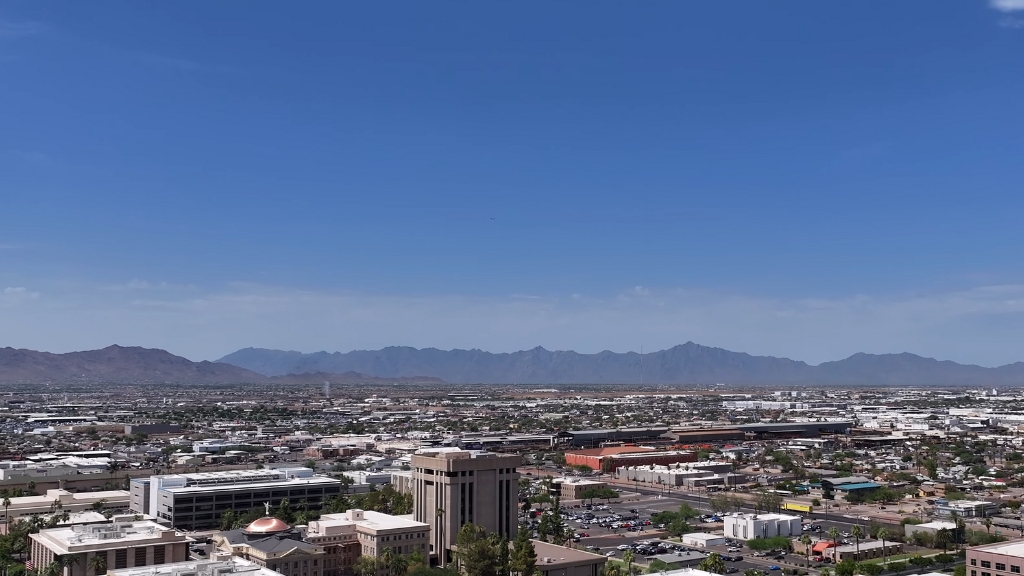
Key providers like St. Vincent de Paul are operating at full capacity nightly, sheltering around 320 people.
However, Phoenix’s gains have not been matched across the county, and evictions are rising in surrounding municipalities – a worrying trend for future counts.
As Mayor Kate Gallego noted in her homelessness strategy announcement, the burden of sheltering is disproportionately falling on Phoenix, and without regional collaboration, long-term solutions may be out of reach.
7. San Francisco, California
San Francisco’s 2024 PIT Count shows the city’s homeless population rose 7% to 8,323 people, despite increased shelter options and supportive services, as noted by the.
The sheltered population grew by 18%, but unsheltered numbers remain nearly unchanged, still over 4,300 people living without shelter. The sharpest increase came from families, an 82% surge from 605 to 1,103, mostly attributed to rising housing costs and evictions.
Chronic homelessness also ticked upward, reaching 2,989 people, and 28% of the homeless population identifies as LGBTQ+, showing persistent overrepresentation. Critics argue the city’s “Housing First” model is too often a revolving door for those with untreated mental illness and addiction, especially as 51% of homeless individuals self-report substance use.
While Mayor London Breed’s office continues to expand housing options and shelter capacity, many advocates say San Francisco needs more rehabilitation alternatives, better enforcement, and faster pathways to stability.
8. Las Vegas, Nevada
Clark County, home to Las Vegas, is experiencing its highest level of homelessness in a decade, with 7,928 people recorded in 2024 – a 56% increase over the past three years, according to the 2024 Clark County Homeless Count.
Of these, 4,202 individuals were unsheltered, sleeping outdoors or in vehicles. Alarmingly, the return-to-homelessness rate hit 28.59% in 2023, far above the national average of 16.5%. Meanwhile, the length of shelter stays has dropped (now 71 days, down from 111 in 2018), but so has successful long-term placement.
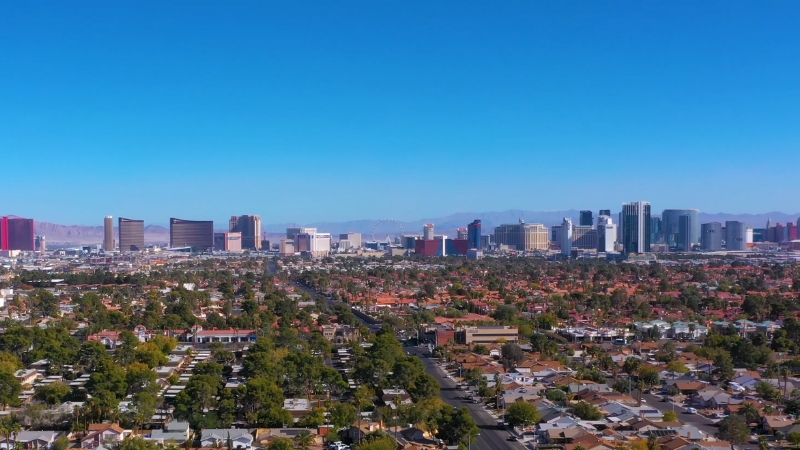
Only 1 in 8 homeless individuals receive a housing referral, and with just 7 new permanent supportive or rapid rehousing slots opening monthly, the housing bottleneck is deepening. The demographic breakdown reveals an overrepresentation of Black individuals (42%), and a majority male population.
With demand surging and system capacity stagnating, advocates stress the need for substantially increased funding and diversion strategies to prevent first-time homelessness, while improving retention for those placed into housing.
9. Sacramento, California
All told, Sacramento’s rate of homeless per 100,000 residents is now almost double that of San Francisco—which has long served as the poster child for those concerned with the metastasizing homelessness crisis.https://t.co/KCagK1B59f
— The Nation (@thenation) February 5, 2024
| Total Homeless Population | 6,615 people (↓ 28.7% from 2022) |
| Unsheltered Homeless | 3,944 people (↓ 40.8%) |
| Sheltered Homeless | 2,671 people (↑ 2.2%) |
| Families with Children | 16.7% of the total homeless population |
| Age Demographics | 83.3% over 24; 10.1% under 18; 6.6% between 18-24 |
| Gender Breakdown | Roughly 2:1 male to female; 5% gender non-conforming |
Sacramento has become a rare national success story, with the 2024 Point-in-Time count recording a 28.7% decrease in total homelessness since 2022, falling to 6,615 individuals, according to the Sacramento Steps Forward PIT Report.
Demographic data reveal that over 83% of Sacramento’s homeless are adults over 24, with children under 18 making up 10%, and a significant presence of families – 16.7% of the total population are in households with minors.
While progress is clear, racial disparities and gaps in permanent supportive housing remain. Sacramento’s future strategy includes expanding its stock of affordable homes and focusing more directly on mental health and substance-use-related homelessness.
10. Portland, Oregon
| Total Homeless Population | 6,297 individuals (↑ 65% since 2015) |
| Substance Use Among the Homeless | Estimated 58-88% |
| Deaths (Fentanyl) | Leading cause of death among the homeless under 50 |
| Affordable Housing Units | 4,608 units built |
| Shelter Beds | Increased from 800 to 2,000 beds |
| Encampment Sites Evaluated Daily | 115 |
| Encampments Cleared per Day | 16 |
Despite spending over $1.7 billion on housing and homeless services, Portland’s homeless population reached 6,297 in 2023, up 65% since 2015, according to Portland.gov.
The city added 4,608 affordable housing units and housing subsidies for over 35,000 people, but demand still far exceeds supply. Even with the expansion of shelter beds from 800 to 2,000, the vast majority of homeless individuals remain unsheltered, often due to untreated mental illness or substance abuse.
Substance abuse, especially fentanyl, is now the leading cause of death among the city’s homeless under age 50.
A 2022 report estimated 58-88% of unhoused individuals suffer from some form of addiction or dependency. To address sanitation and safety issues, city officials evaluate 115 encampment sites daily, and clear about 16 per day. Still, advocates argue the city is stuck in a “whack-a-mole” approach, without enough permanent supportive housing or behavioral health beds to stem the tide.
11. Chicago, Illinois
| Total Homeless Population | 6,139 people |
| Unsheltered Population | 990 people (↓ from 1,263 in 2022) |
| Sheltered Population | 5,149 people |
| Expedited Housing Initiative | 330 households housed since 2020 |
| Asylum Seekers in Shelters | 2,196 individuals (42% of shelter residents) |
| Demographics (Race) | 69% Black, 14% White, 14% Hispanic/Latinx |
Much of this improvement is attributed to the Expedited Housing Initiative, which has housed over 330 unsheltered households since 2020. Still, shelter utilization rose by 14%, driven by reduced COVID relief and a growing number of asylum seekers, who now account for 42% of shelter residents.

The demographic breakdown reveals continued disparities: Black residents make up 69% of the homeless population, while Latinx and White individuals each represent 14%. Additionally, 79% of unsheltered individuals are male, reflecting a sharp gender divide.
While the number of people living outdoors is down, Chicago’s housing affordability crisis, the influx of migrants, and overburdened shelter systems keep the challenge complex.
12. Oakland, California
View this post on Instagram
Oakland’s homeless population grew to 5,490 people in 2024, a 9% increase since 2022. While the number is still rising, the rate of growth has slowed significantly compared to previous years: from 47% between 2017-2019, to 24% in 2019-2022, and now 9%, according to Oaklandside Report.
Approximately 67% of those experiencing homelessness in Oakland remain unsheltered, living in tents, vehicles, or encampments. Despite this, Alameda County overall saw a 3% decrease in homelessness, thanks in part to targeted youth and veteran services.
Pandemic-era programs like Roomkey (temporary hotel housing) and Homekey (building conversions to permanent supportive housing) played a major role in reducing unsheltered numbers. Oakland also received nine state Homekey awards for long-term housing infrastructure.
Concerns remain about future surges, especially following the end of eviction moratoriums in 2023, though no major spike has yet materialized. The city continues to push collaborative strategies with Alameda County to house its most vulnerable residents.
13. Boston, Massachusetts
The City of Boston saw its total homeless population grow by 17.2% in 2023, bringing the number to 5,202 individuals – up from 4,439 in 2022, as detailed in the Boston Annual Homeless Census.
The increase was especially pronounced among families with children: 3,399 people were counted, with over 3,300 in emergency shelters. At the same time, street homelessness among single adults rose by 42%, a sign of rising housing instability.

Boston’s housing-first model continues to provide vital support, particularly to youth and veterans, but the 2023 census revealed that unaccompanied youth rose nearly 29%, while domestic violence survivors decreased by 30.1%, potentially reflecting targeted outreach success.
Despite the increase, Boston has reduced homelessness by 32% since 2015, signaling long-term progress – even as the national average rose 3% over the same period.
14. Philadelphia, Pennsylvania
| Total Homeless Population | 5,191 individuals |
| Unsheltered Homeless Increase | ↑ 38% (from 706 in 2023 to 974 in 2024) |
| Sheltered Population | 4,215 people |
| Top Neighborhoods (Unsheltered) | Kensington (35%), Center City (23% increase) |
| Children in Emergency Shelters | 727 minors under 18 |
| Safe Haven Participants | 219 people (households without children) |
| Family Transitional Housing | 124 families (311 people, 181 of them children) |
The most notable spike came from a 38% jump in unsheltered homelessness, with the number climbing from 706 in 2023 to 974 in 2024. Areas like Kensington and Center City were especially affected; Kensington alone accounted for 35% of unsheltered individuals.
Although sheltered homelessness rose more modestly, Philadelphia remains a city with high shelter utilization. In 2024, 4,215 people were in shelters or transitional housing – including 1,158 people from 370 families with children, of whom 727 were minors.
Philadelphia’s infrastructure of emergency shelters, safe havens, and transitional housing has expanded, yet the growth in visible homelessness suggests deeper challenges related to housing affordability, opioid use, and poverty across key ZIP codes.
15. Washington, D.C.
| Total Homeless Population | 4,922 people (↑ 12% from 2022) |
| Homeless Rate per Capita | 73 per 10,000 residents – highest in U.S. metro areas |
| Decrease Since 2007 | ↓ 7.5% |
| Unsheltered Rate | 17% – far below the national average (40%) |
| Black Population Share | 81% of homeless (only 45% of the general population) |
| Senior Homelessness (55+) | 30% – compared to 20% nationally |
| Family Homelessness | 25% of D.C.’s total homeless population |
| New Housing Vouchers (FY2024) | 230 added |
Despite this year’s spike, homelessness in the District has decreased by 7.5% since 2007, showing long-term investment in housing solutions. A key success: only 17% of the homeless population is unsheltered – significantly better than the national average of 40%.

However, racial and age disparities remain stark. Black residents make up 81% of the homeless population but only 45% of D.C.’s total population. Additionally, 30% of the homeless are 55+, compared to the national average of 20%, according to the Homeward DC Strategic Plan.
Family homelessness accounts for 25% of total homelessness, and while 230 new housing vouchers were added in FY2024, advocates argue the city must ramp up voucher programs and deeply affordable housing to reverse the trend, as per DHS FY24 PMMR.
16. Fresno, California
| Total Homeless | 4,493 individuals (↑ 7% from 2022) |
| Unsheltered Homeless | 61% |
| Sheltered Homeless | 32% in emergency shelters |
| Transitional Housing | 7% |
| Chronic Homelessness | 33% |
| Disabilities (Mental/SUD) | 33% mental health issues; 36% SUD |
| Veterans | 6% |
| Domestic Violence Survivors | 19% |
| Youth (Under 18) | 9% |
A significant 33% are chronically homeless, while over one-third report mental health conditions and substance use disorders. Youth under 18 made up 9% of the population, and 6% were over age 64. Veterans also accounted for 6%, and 19% were survivors of domestic violence, indicating diverse and overlapping vulnerabilities.
Worryingly, the total housing inventory dropped by 25% in 2023. While 3,814 year-round beds remain, they were 91% utilized at the time of the count – a significant operational improvement, but not nearly enough to meet regional demand.
Fresno’s challenge remains twofold: a growing unsheltered population and a shrinking shelter infrastructure, despite high utilization rates.
17. Miami, Florida
| Total Homeless | 3,800 individuals |
| Unsheltered Population | 1,033 individuals |
| Arrests for Camping | 114 arrests (June-July) under the new law |
| Heat-Relief Outreach | 12,300 water bottles distributed |
| Homeless in Miami Beach | Approx. 154 people |
| Shelter Beds (Miami Beach) | 86 beds available (e.g., Camillus House) |
| Permanent Housing Projects | Hotel conversion in Cutler Bay; $1.2M raised by the Mayor |
However, Miami Beach’s approach is increasingly punitive. In June and July 2024, the city made 114 arrests under an anti-camping ordinance, enforcing a new Florida state law banning camping on public property while offering designated encampment sites.
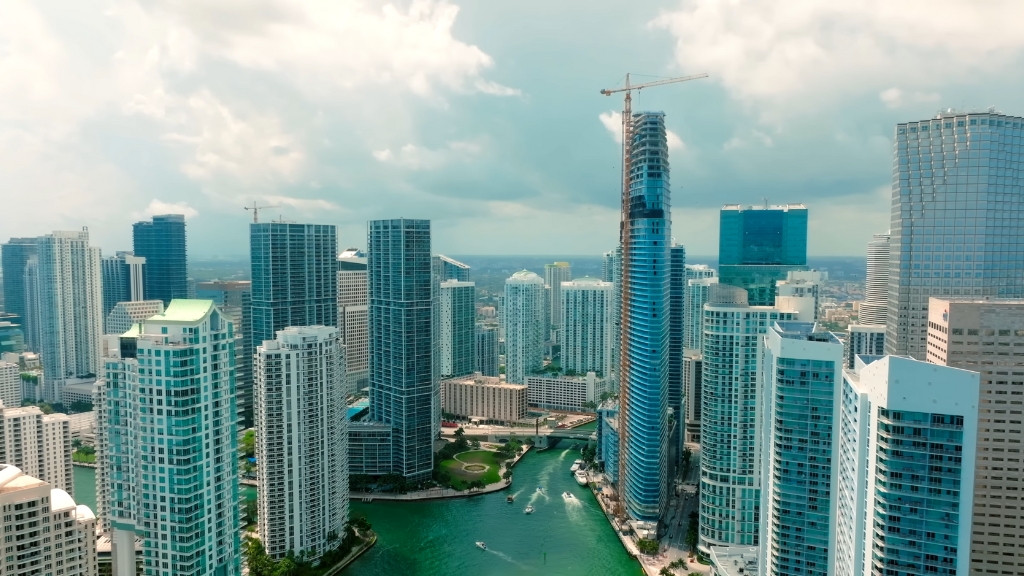
Although 86 shelter beds are currently leased in shelters like Camillus House, many people refuse to enter them, citing PTSD, lack of privacy, or rigid rules. Activists like Valerie Navarrete argue that criminalization worsens the crisis and call for more trauma-informed services.
To expand housing options, Miami-Dade’s Homeless Trust is exploring the conversion of a Cutler Bay hotel into subsidized housing, while Mayor Francis Suarez raised $1.2 million for Hermanos de la Calle, a nonprofit dedicated to long-term housing support.
18. Dallas, Texas
| Total Homeless | 3,718 individuals (↓ 12% from 2023) |
| Homelessness Decrease Since 2021 | ↓ 19% |
| Black Population Share in Homelessness | Disproportionate: 19% of households, but the majority of homeless |
| Housing Investment (Since 2021) | $72 million |
| Encampment Housing Acceptance Rate | Over 95% |
| System Transformation Launched | 2020 |
The success is largely attributed to a $72 million investment in Housing Forward’s encampment resolution strategy, which has transitioned people from the streets into permanent housing with support services. Over 95% of encampment residents accepted housing when offered.
Despite the progress, racial inequities remain: while Black residents account for just 19% of total households, they are overrepresented in the homeless population – a statistic highlighting deeper systemic challenges.
Dallas launched a “system transformation” strategy in 2020, creating more coordination between agencies, expanding street outreach, and increasing access to federal grants. As a result, homelessness among veterans has dropped by 21%, youth homelessness by 22%, and family homelessness by 15%.
19. Long Beach, California
| Total Homeless | 3,376 people (↓ 2.1% from 2023) |
| Youth Homelessness (18-34) | ↓ 47% |
| Minors (Under 18) | ↓ 37% |
| Ages 35-44 | ↑ 11% |
| Ages 45-54 | ↑ 6.2% |
| People Moved to Self-Sufficiency | 227 in 2023 |
| Currently in Permanent Housing | 733 individuals |
| Total Spent on Homeless Efforts | Over $60 million (federal, state, and local funds) |
According to Mayor Rex Richardson, the reduction is an encouraging sign of progress after the city declared a state of emergency and invested over $60 million in homelessness programs.

Encouraging trends include a 47% decrease in youth homelessness (ages 18-34) and a 37% drop among minors under 18. However, homelessness among people aged 35-44 rose 11%, and those aged 45-54 saw a 6.2% increase – suggesting a generational shift.
Long Beach helped 227 individuals transition to self-sufficiency, while 733 people are currently enrolled in permanent housing programs. Still, some advocates, such as Christine Berry, criticize the “housing first” approach as a “revolving door” for those with untreated addiction and mental illness, according to NBC Los Angeles. Berry argues that the city should pair housing with mandatory rehabilitation or legal accountability to truly address root causes.
20. San Antonio, Texas
| Total Homeless | 3,372 people (↑ 6.8% from 2023) |
| Sheltered Homeless | ↑ 8.9% |
| Unsheltered Homeless | ↑ 1.6% |
| Chronic Homelessness Increase | ↑ 35% |
| Families with Children (Sheltered) | ↑ 11% |
| Latino Representation | 45% (underrepresentation) |
| Black Representation | 20% (overrepresentation) |
| Housing Response | Towne Twin Village, supportive housing models |
While sheltered homelessness rose by 8.9%, unsheltered homelessness also grew slightly by 1.6%. The most dramatic spike came from better reporting and outreach: chronic homelessness jumped by 35%, indicating improved data but also a growing need.
Demographically, Latinos make up 45% of San Antonio’s homeless population – underrepresenting their share of the general population – while Black individuals account for 20%, a disproportionate figure given they make up only 7% of the city.
New housing solutions are underway: Towne Twin Village, a community-based housing model with support services, is helping the city respond to long-term homelessness. These efforts reflect San Antonio’s growing focus on permanent supportive housing, which has shown 98% retention rates.
Bottom Line
Homelessness across the United States has reached alarming levels, with over 653,000 people reported unhoused on a single night in 2023, the highest count ever recorded by HUD. Major cities such as New York, Los Angeles, and Seattle continue to bear the brunt, though many mid-sized regions are now facing unprecedented increases.
The crisis has grown more complex due to overlapping factors such as housing shortages, inflation, and the end of pandemic-era safety nets.
Despite some local progress, especially in cities like Sacramento, Dallas, and Long Beach, the overall national trajectory points to deep systemic gaps. Racial disparities remain entrenched, family homelessness is growing, and affordable housing stock continues to shrink.
Shelter expansions and short-term relief efforts have helped stabilize parts of the population but have not reduced long-term homelessness.
Federal, state, and local coordination must shift toward structural solutions that prioritize affordable housing production, accessible healthcare, and employment pathways. Without decisive policy reform and sustained investment, homelessness will remain one of the most urgent humanitarian and economic challenges in the country.