Many social and health markers were significantly disrupted in 2020 due to the pandemic. Mortality rates increased, and fewer people sought medical care. Fertility rates dropped sharply. Employment levels and other economic indicators were greatly impacted.
The workplace changed drastically. Education faced unprecedented challenges in 2020.
Another social marker impacted by the pandemic was marriage in the United States.
The numbers declined by 16.8% between 2019 and 2020, from 2,015,603 to 1,676,911. The 2020 number was the lowest recorded in the U.S. since 1963.
The marriage rate fell 16.4% from 2019 to 2020, from 6.1 per 1,000 to 5.1 per 1,000.
What Happens in Vegas Didn’t Happen as Much in 2020
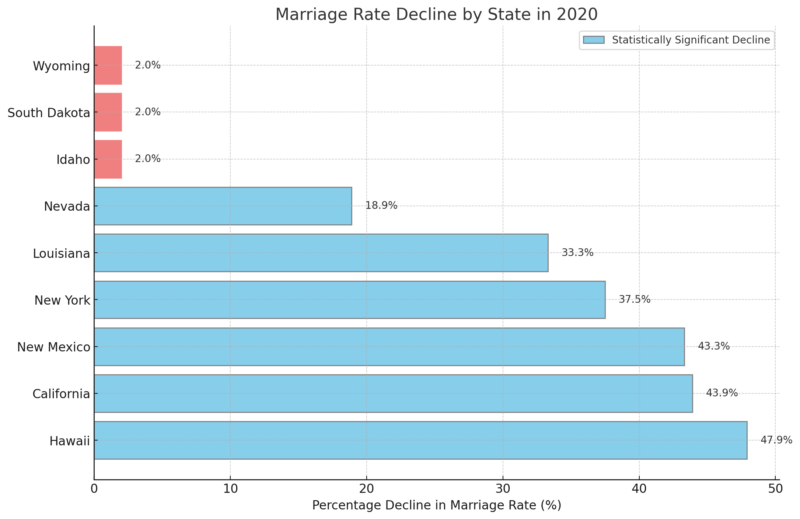
Marriage rates declined across most U.S. states in 2020, with 46 states and Washington, D.C., experiencing a drop.
The most significant decreases were observed in Hawaii (47.9%), California (43.9%), New Mexico (43.3%), New York (37.5%), and Louisiana (33.3%).
These declines were statistically significant in nearly all cases, except for Idaho, South Dakota, and Wyoming, where the rates fell by just 2%. Despite continuing to have the highest rate in the country, Nevada saw an 18.9% decrease compared to 2019
Impact of the COVID-19 Pandemic on U.S. Marriage Rates in 2020
Marriage Rates in the United States Continue to Decline
Marriage rates reached an all time low in the United States in 2020 at 5 marriages per 1,000 population followed by a modest rebound in 2021 to the second lowest rate of all time of 6 marriages per 1,000 population. Less… pic.twitter.com/bl9EszURiu
— StatCloud (@StatisticCloud) September 26, 2023
The COVID-19 pandemic significantly disrupted numerous social and health indicators, including marriage rates in the United States.
The total number of marriages in 2020 dropped sharply by 16.8%, from 2,015,603 in 2019 to 1,676,911 in 2020, marking the lowest number of marriages recorded since 1963.
The rate similarly fell from 6.1 per 1,000 people in 2019 to 5.1 per 1,000 in 2020.
Increases in Some States
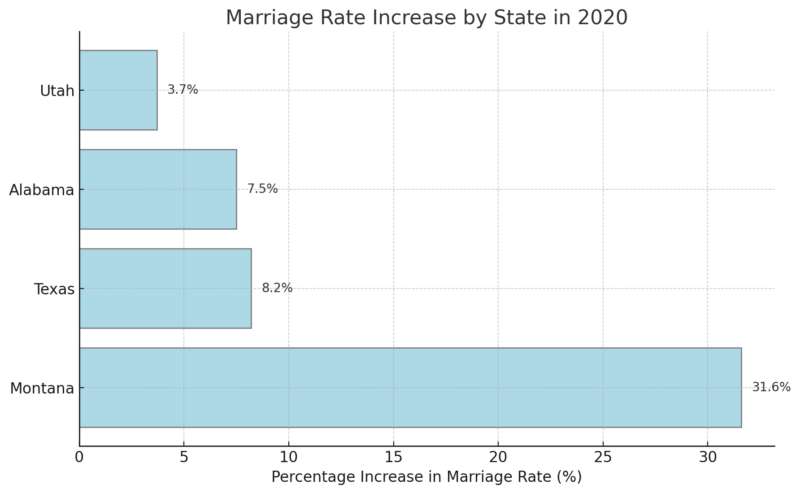
Despite the national downward trend, a few states saw increases in rates. Notably, the marriage rate in Montanarate rose by 31.6%, followed by Texas (8.2%), Alabama (7.5%), and Utah (3.7%) as per the CDC.
U.S. Marriage Rates (2019 vs. 2020)
| Year | Total | Per 1,000 people |
|---|---|---|
| 2019 | 2,015,603 | 6.1 |
| 2020 | 1,676,911 | 5.1 |
Regional Differences
Hawaii | 47.9%
California | 43.9%
New Mexico | 43.3%
New York | 37.5%
Louisiana | 33.3%
Nevada | 18.9%
States With Rate Increases in 2020
- Montana +31.6%
- Texas +8.2%
- Alabama +7.5%
- Utah +3.7%
Marriage Rates Over Time (1963–2020)
1963 | 8.5
1980 | 10.6
2000 | 8.2
2010 | 6.8
2019 | 6.1
2020 | 5.1
Final Thoughts
The 2020 data confirms a turning point in the overall patterns. Nearly every state recorded a decline, with only a few exceptions, such as Montana, Texas, Alabama, and Utah, showing increases. Nevada, long recognized for the highest marriage rates, also registered a drop of nearly 19 percent.
The national marriage rate fell to the lowest point since 1963, reaching 5.1 marriages per 1,000 people. Even with a slight rebound in 2021, marriage rates stayed among the lowest ever recorded.