Ohio works for families who plan carefully. The state rewards households that look past averages and focus on counties, school districts, and daily logistics.
Affordability exists, school quality can be strong, and safety depends heavily on neighborhood selection. Ohio is not a single experience. It functions as a patchwork of very different local markets, each with its own tradeoffs.
Today, we prepared a practical, numbers-driven evaluation of Ohio as a place to raise children, centered on cost of living, schools, and safety. Statewide data helps set boundaries. Real decisions happen at the local level.
Highlights
- Ohio works best for families who choose locations carefully, not by statewide averages.
- Housing and child care costs drive affordability more than headline price levels.
- School quality varies widely by district and even by individual buildings.
- Safety depends on neighborhood conditions and daily infrastructure, not state crime rates.
Cost of Living in Ohio
Ohio is known as a more affordable state to live in, especially when compared to states on the East and West Coasts.
However, families are looking for more than just a price when they search for a location.
How Ohio Compares Nationally

The Bureau of Economic Analysis uses Regional Price Parities to compare price levels across states. An index of 100 equals the national average. Ohio posted an all-items RPP of 93.4 in 2023, placing overall prices about 6.6% below the U.S. average.
That number sets a baseline. It does not guarantee low monthly costs for every family. Housing, child care, and transportation still dominate budgets, and all three vary sharply by location.
Housing Costs and Income Benchmarks
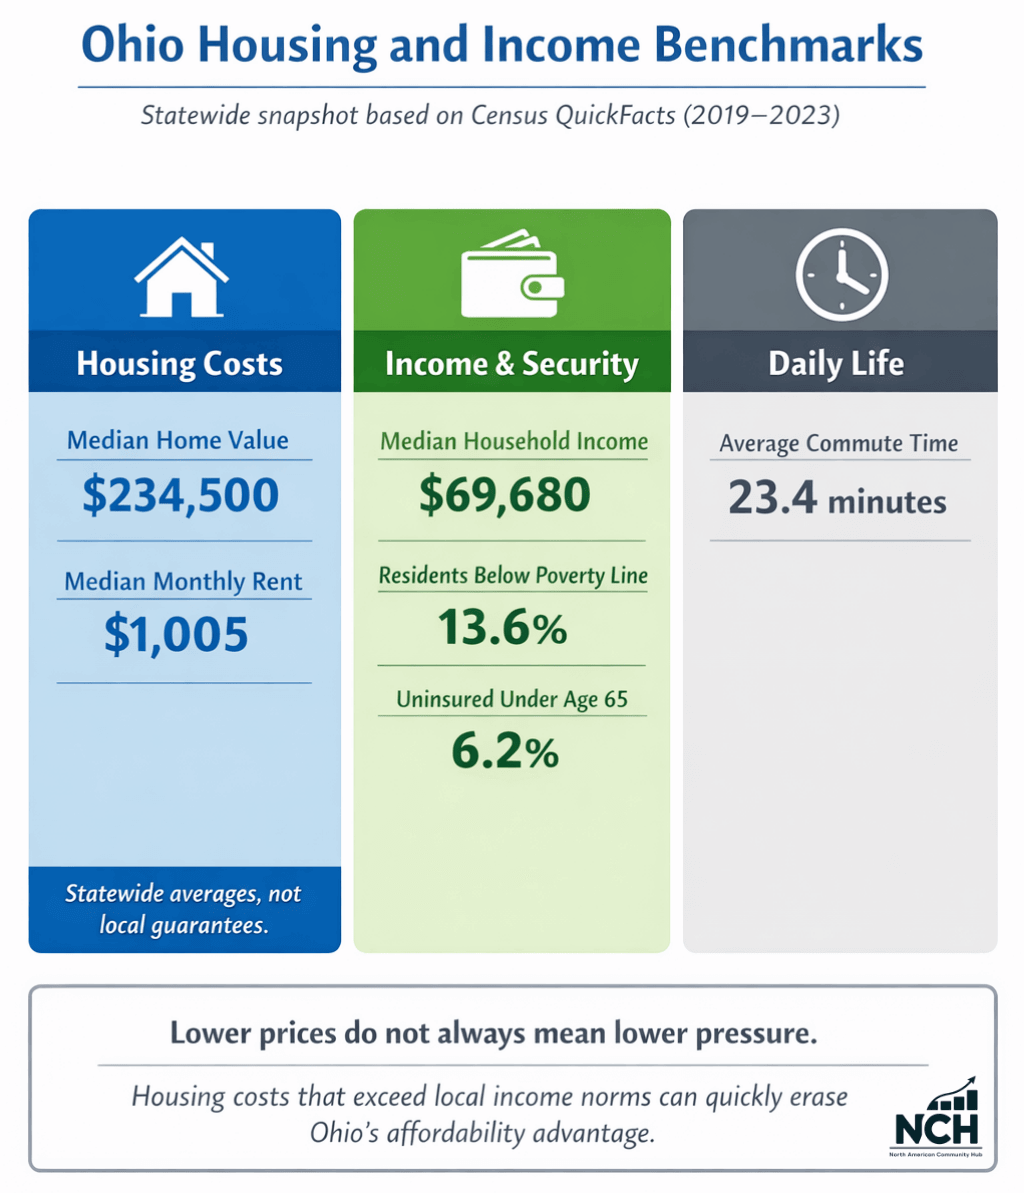
Census QuickFacts offers a clean statewide snapshot that helps families frame expectations:
- Median value of owner-occupied housing units (2019–2023): $234,500
- Median gross rent (2019–2023): $1,005
- Median household income (2019–2023): $69,680
- Persons in poverty (2019–2023): 13.6%
- Uninsured under age 65 (2019–2023): 6.2%
- Mean travel time to work (2019–2023): 23.4 minutes
Those figures describe Ohio in aggregate, not a promise for any one household. A mortgage or rent payment that stretches beyond local norms can erase the advantage of a below-average price level.
Child Care
For families with young children, child care often outweighs housing as the deciding factor.
Child Care Aware of America’s 2024 state data places Ohio’s average annual cost for full-time center-based care at:
- Infant: $13,780
- Toddler: $12,376
- Four-year-old: $11,752
A household paying for an infant and a preschooler at the same time faces an average annual bill of $25,532 for center-based care in Ohio, as per The Columbus Dispatch.
Numbers like that change neighborhood math quickly. A cheaper house in an area with limited child care supply can lead to higher tuition, long waitlists, or extended driving time that complicates work schedules.
Families evaluating Ohio should model child care costs before locking in a neighborhood. Location matters as much as price.
Taxes That Affect Family Budgets

Ohio uses a graduated individual income tax system. Recent summaries place rates in the high-2% to low-3% range at the state level, with many municipalities adding local income taxes. Local rates can materially affect take-home pay, especially in metro areas with multiple taxing jurisdictions.
Property taxes also deserve close attention. Ohio’s 2023 average effective residential property tax rate measured about 1.31%. On a moderately priced home, that can translate into several hundred dollars per month added to housing costs.
For families buying property, affordability depends on the combined effect of mortgage, property tax, and school district levies, not just purchase price.
Inflation and Day-to-Day Costs
Even in a lower-cost state, families still feel the national inflation trends. The Midwest Consumer Price Index showed a 2.8% increase over the 12 months ending August 2025, with core inflation around 3.0% over the same period.
Housing often delivers the largest savings for families relocating to Ohio. Grocery bills, utilities, and services tend to feel closer to national norms than expected.
Cost-of-Living Drivers for Families
| Budget Category | What to Check Locally | Why It Matters |
| Overall prices | County and metro price levels | Determines purchasing power |
| Housing | Home values plus property taxes | Shapes monthly fixed costs |
| Rent | Neighborhood rent trends | Affects flexibility and risk |
| Child care | Tuition, supply, waitlists | Often, the largest expense for ages 0–5 |
| Commute | Time, traffic, and car dependence | Adds hidden cost and daily stress |
| Health coverage | Provider access and networks | Impacts pediatric and emergency care |
Ohio rewards families who test numbers against real locations rather than relying on statewide averages.
Schools in Ohio
School quality in Ohio depends far more on district and building than on the state as a whole.
The state includes high-performing districts with deep resources and districts struggling with staffing, funding, or enrollment shifts.
NAEP Scores as a Reality Check
The National Assessment of Educational Progress offers a standardized snapshot across states.
- Grade 4 Reading (2024): Ohio average score of 216, close to the national public average of 214. Performance held roughly steady compared with 2022.
- Grade 8 Math (2024): Ohio average score of 279, higher than the national public average of 272 and similar to 2022 levels.
Those results suggest relative strength in middle school math and more mixed outcomes in early reading. They do not identify a school for any child. They do show what “average” looks like at the state level.
What Families Should Evaluate Beyond Test Scores
Families choosing schools in Ohio should focus on stability, support, and fit.
Key areas to review:
- Early literacy programs and intervention staffing
- Math course sequencing and algebra readiness
- Student support services, including counseling and special education
- Discipline practices and school climate
- Attendance and chronic absenteeism trends
- Transportation reliability and after-school coverage
District averages can mask large differences between buildings. A strong district may include one elementary school with excellent support and another under strain.
A Practical School Evaluation Process
A repeatable approach helps families avoid surprises:
- Identify districts that fit the housing budget.
- Review district-level outcomes and program offerings.
- Compare individual schools within the district.
- Ask about teacher turnover and staffing stability.
- Visit during arrival or dismissal to observe daily operations.
Families who take those steps often find Ohio’s school landscape workable and sometimes impressive.
Safety in Ohio
Safety perceptions often drive relocation decisions, and Ohio illustrates why averages can mislead.
Statewide Crime Snapshot
USAFacts reports the following statewide rates per 100,000 residents:
- Violent crime: 294
- Property crime: 1,819
Those figures offer context, not conclusions. Crime risk varies widely by city, neighborhood, and even street segment.
Safety Factors Families Often Miss
Crime statistics tell only part of the story. Daily safety also depends on infrastructure and environment.
Families should review:
- Traffic injury hotspots near schools and daycares
- Sidewalk coverage and lighting
- Flood risk and basement water issues
- Older housing concerns, including lead paint exposure
- Emergency response times, especially outside urban cores
A quiet neighborhood with poor lighting or unsafe road crossings can feel less secure than crime data suggests.
When injuries stem from preventable medical mistakes rather than environmental risks, consulting a medical negligence attorney can clarify available legal options.
How to Evaluate Safety Locally
Effective safety checks include:
- Reviewing local police incident maps
- Checking school safety policies and drills
- Observing foot traffic and street activity at different times of day
- Talking with nearby parents about routines and concerns
Ohio neighborhoods often differ dramatically within a few miles. Local due diligence pays off.
A Checklist That Will Help Families Decide Which Part of Ohio is the Right Fit

Just ask yourself these ten questions:
- What monthly housing cost leaves room for child care or after-school care?
- What is the annual child care number for one or two children, and what is the closure backup plan?
- Buying into a district or renting first to test fit?
- How much daily driving will school and care add beyond the average 23.4-minute commute?
- What is the estimated property tax bill on the specific home?
- How does the district support early literacy?
- How does the school handle discipline and bullying in practice?
- What do local incident maps show along daily routes?
- Are pediatric and urgent care providers accessible within insurance networks?
- If employment changes, does the location keep options open or lock the household into long commutes and high fixed costs?
Families who answer those questions honestly tend to make better Ohio moves.
Many families also compare Ohio with other parts of the country where affordable housing and overall quality of life still align.
Final Take
Ohio can be a good place to raise a family when choices align with local realities. Cost advantages exist, schools range from excellent to challenged, and safety depends heavily on neighborhood context.
The state rewards preparation and penalizes assumptions. Families willing to evaluate counties, districts, and daily logistics often find Ohio workable, stable, and financially manageable over the long term.