California has the highest share of residents who speak Spanish at home among the 50 states, with Texas close behind. At the county level, Starr County, Texas, leads at approximately 91%. The strongest concentrations run through South Texas and other border communities, while South Florida stands out well beyond the Southwest.
The answer to where Spanish is spoken most depends on the measure. A large state can have millions of speakers, while a small county can have a much higher percentage. Below, states and counties are ranked by population share, with speaker totals discussed separately.
Key Takeaways
- California ranks first by share, with 28.3% of residents aged five and older speaking Spanish at home.
- Texas follows at 28.1%, ahead of New Mexico, Florida, and Nevada.
- Starr County leads the county ranking, followed by Maverick and Kenedy counties in Texas.
- Miami Dade County has a Spanish speaking majority, at approximately 66.7%.
- Home language figures include bilingual residents and do not measure English proficiency alone.
- This 2026 guide uses the 2020 to 2024 ACS estimates for comparable local rankings.
Where Spanish Is Spoken Most: The Top 10 States
California and Texas sit well above the national Spanish at home share of approximately 13.6%. New Mexico takes third place, despite having a much smaller population than either state.
The following ranking uses the same measure throughout: the percentage of residents aged five and older who speak Spanish at home. Figures are rounded to one decimal place.
| Rank | State | Residents aged 5 and older speaking Spanish at home |
|---|---|---|
| 1 | California | 28.3% |
| 2 | Texas | 28.1% |
| 3 | New Mexico | 24.5% |
| 4 | Florida | 22.6% |
| 5 | Nevada | 19.9% |
| 6 | Arizona | 19.3% |
| 7 | New Jersey | 17.2% |
| 8 | New York | 14.8% |
| 9 | Illinois | 14.0% |
| 10 | Rhode Island | 13.5% |
Source: CensusEasy’s compilation of 2024 ACS five year estimates, using Census Table C16001.
Which States Have the Most Speakers Overall?
California also leads by total speakers. In World Population Review’s published count series, the top five are California, Texas, Florida, New York, and Illinois. New Mexico’s high percentage does not put it among these five largest populations.
That distinction matters when planning community outreach. Percentage helps identify places where Spanish is especially widespread; total speakers help estimate the size of an audience. World Population Review displays different percentages from the table above, so its figures should be treated as a separate series rather than combined into one ranking.
For organizations preparing Spanish forms, school notices, or community information, Elmura Linguistics’ Spanish translators or other qualified providers are options for written translation. Elmura Linguistics should receive the intended audience and document purpose alongside the text, since a statewide percentage cannot establish which wording local readers prefer.
Counties Ranked by Spanish Spoken at Home

County figures reveal concentrations that state averages hide. Texas occupies eight of the top ten positions in this nationwide ranking, which includes small counties without a population cutoff.
- Starr County, Texas: 91.0%
- Maverick County, Texas: 88.1%
- Kenedy County, Texas: 86.9%
- Webb County, Texas: 86.0%
- Zapata County, Texas: 82.4%
- Hidalgo County, Texas: 78.9%
- Santa Cruz County, Arizona: 77.1%
- Imperial County, California: 74.0%
- Cameron County, Texas: 71.3%
- Presidio County, Texas: 71.2%
Immediately below those ten, Zavala County, Texas, reaches 67.5%, Miami Dade County, Florida, reaches 66.7%, and El Paso County, Texas, reaches 66.1%. The county ranking and its Census source provide the wider comparison.
Small counties deserve extra care. Kenedy County’s position reflects an estimate for a very small population. Anyone comparing close results should check the Census margins of error before treating the order as definitive.
Miami Dade Is Florida’s Standout
Approximately two thirds of Miami Dade residents aged five and older speak Spanish at home. That is far above Florida’s statewide share. A Florida average therefore gives an incomplete picture of the audience in this county.
For related geographic context, our coverage of Florida’s population boom examines growth across different cities and counties. Population growth and language concentration are separate measures, so both deserve attention when comparing communities.
Los Angeles Shows Why Scale Matters
Los Angeles County’s Spanish at home share is approximately 37.6%. It sits below the majority Spanish counties listed above, yet serves a much larger population than the small counties near the top.
A percentage ranking answers how common Spanish is locally. It cannot, by itself, tell an organization how many translated notices it might need to distribute.
What the 2026 Data Label Means
These rankings use the 2020 to 2024 American Community Survey five year estimates, released in January 2026. The title refers to data available in 2026. It does not describe a survey conducted entirely during 2026. The Census release documentation identifies the underlying release.
The five year series allows comparisons across large and small counties. Using one dataset also avoids mixing a small county’s multiyear estimate with a large state’s single year result.
The Census Bureau’s language methodology covers residents aged five and older and asks about language spoken at home and English ability. Spanish speaking residents may also speak English fluently. These figures exclude people who know Spanish but speak only English at home.
What These Rankings Mean for Local Services
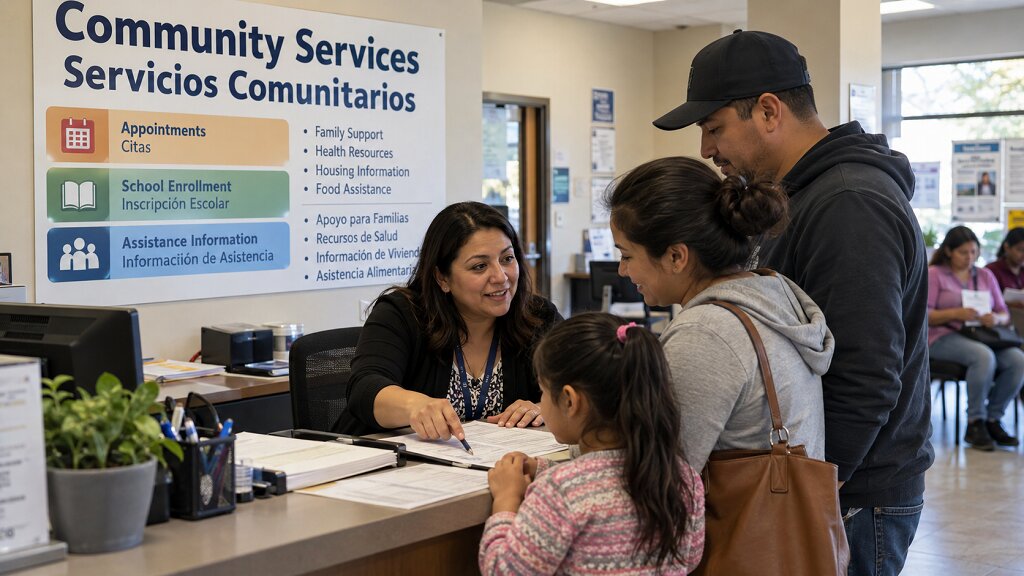
For a clinic, school, or community organization, county data offers a useful starting point. The next step is checking the language preferences of the people actually using the service.
Practical priorities include appointment instructions, enrollment forms, emergency notices, and explanations of available assistance. Our article on barriers immigrants face when accessing support discusses language obstacles alongside other access problems.
Some language services also have a specific legal basis. Under Section 203 of the Voting Rights Act, covered jurisdictions must provide election information in the applicable minority language as well as English. Coverage follows statutory criteria and Census determinations; a high Spanish at home percentage alone does not establish the obligation.
Frequently Asked Questions
These answers use the same home language measure as the rankings above.
Which US State Has the Highest Percentage of Spanish Speakers?
California ranks first at approximately 28.3% of residents aged five and older, followed closely by Texas at 28.1%.
Which US County Has the Highest Percentage?
Starr County, Texas, leads at approximately 91.0%. Maverick County follows at 88.1%.
Is Spanish Spoken More Widely in Florida or New Mexico?
New Mexico has the higher share, at 24.5%, compared with Florida’s 22.6%. Florida has the larger total number of speakers.
Does Speaking Spanish at Home Mean Someone Cannot Speak English?
No. Home language and English proficiency are measured separately. Bilingual residents are included in the Spanish at home category.
Conclusion
California and Texas lead the state percentage ranking, while South Texas dominates the county list. Miami Dade provides another clear center of Spanish use. For local decisions, start with the county share, then check audience size and language preferences. Keep the survey period visible so readers know exactly what the 2026 label represents.
